29
/
en
AIzaSyAYiBZKx7MnpbEhh9jyipgxe19OcubqV5w
April 1, 2024
107221
Colombia
COL
true
2
1
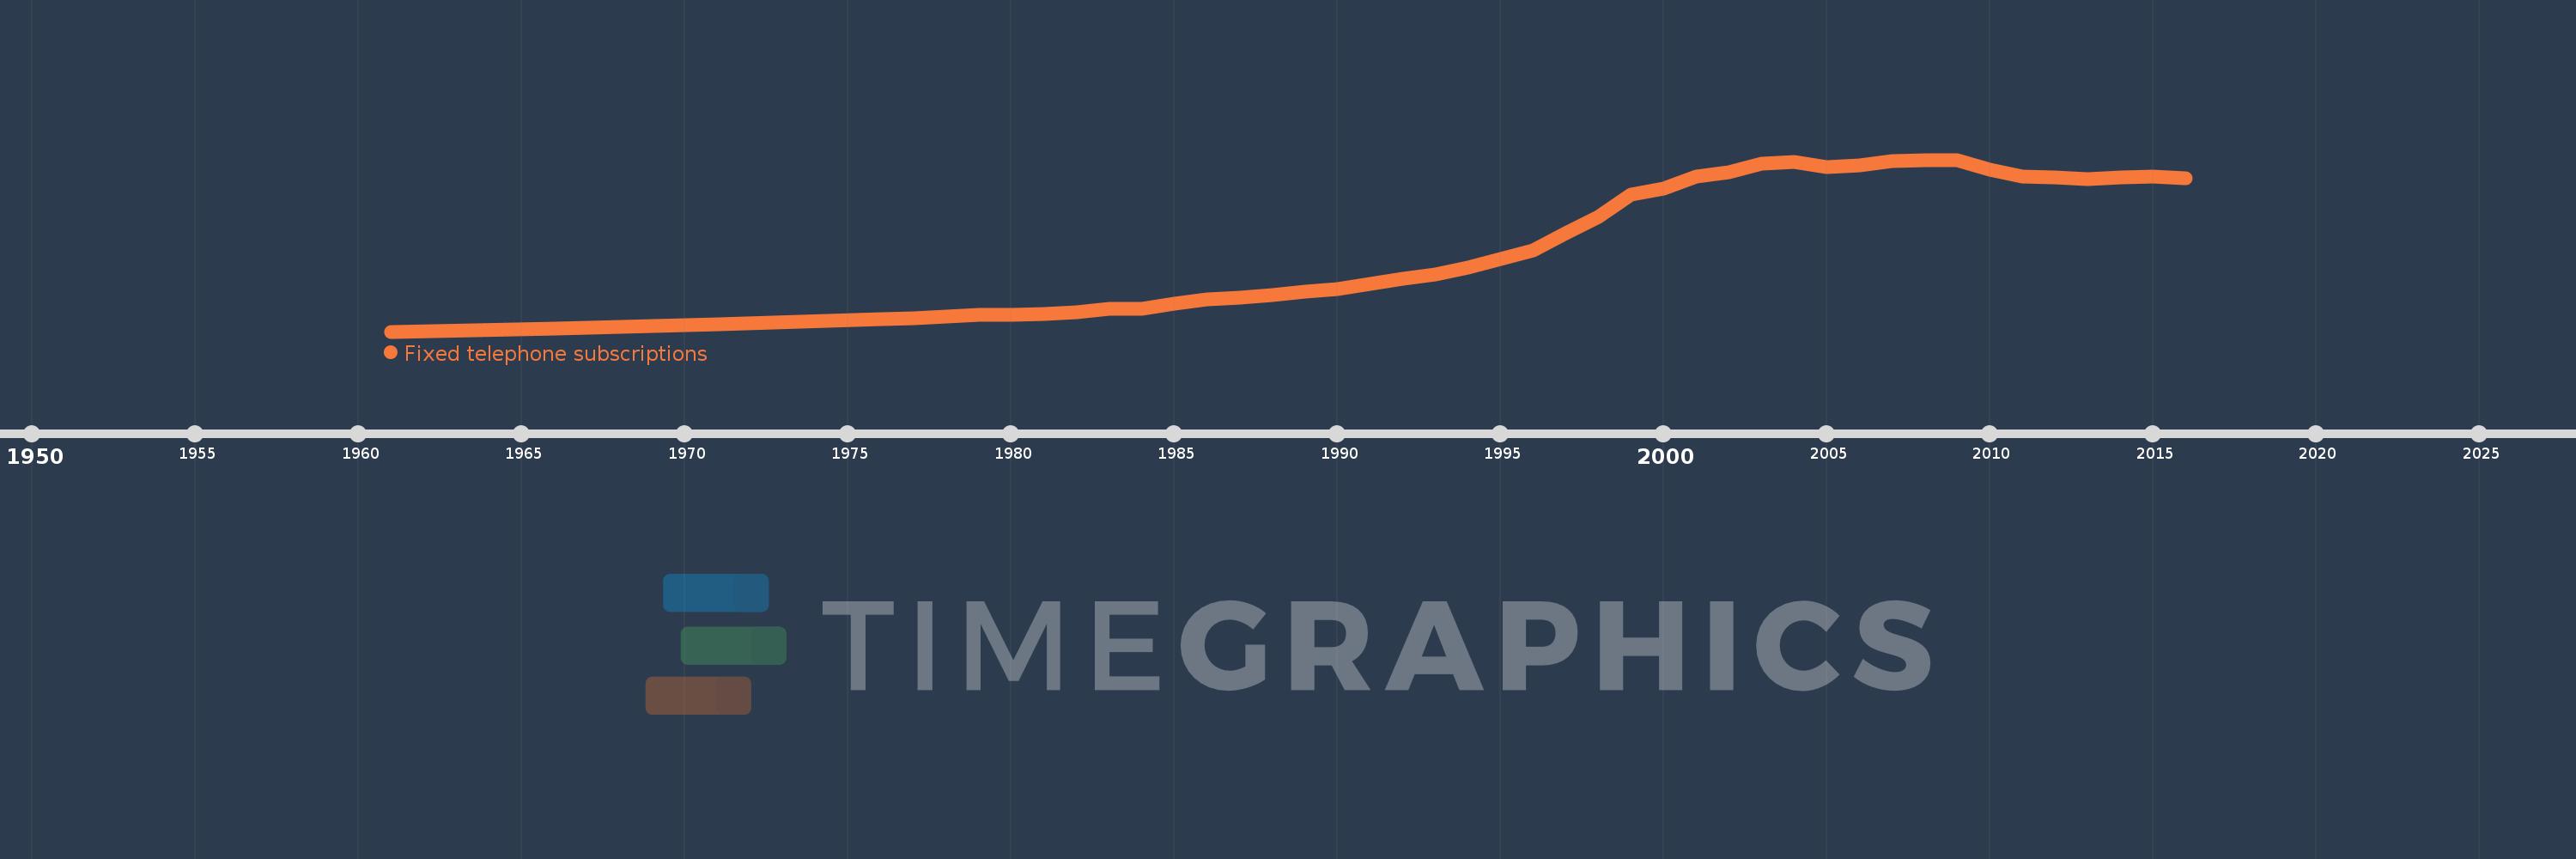
Fixed telephone subscriptions
2016,2015,2014,2013,2012,2011,2010,2009,2008,2007,2006,2005,2004,2003,2002,2001,2000,1999,1998,1997,1996,1995,1994,1993,1992,1991,1990,1989,1988,1987,1986,1985,1984,1983,1982,1981,1980,1979,1978,1977,1976,1971,1966,1961
This statistics in other country:
AfghanistanAlbaniaAlgeriaAmerican SamoaAndorraAngolaAntigua and BarbudaArab WorldArgentinaArmeniaArubaAustraliaAustriaAzerbaijanBahamas, TheBahrainBangladeshBarbadosBelarusBelgiumBelizeBeninBermudaBhutanBoliviaBosnia and HerzegovinaBotswanaBrazilBritish Virgin IslandsBrunei DarussalamBulgariaBurkina FasoBurundiCabo VerdeCambodiaCameroonCanadaCaribbean small statesCayman IslandsCentral African RepublicCentral Europe and the BalticsChadChileChinaColombiaComorosCongo, Dem. Rep.Congo, Rep.Costa RicaCote d'IvoireCroatiaCubaCuracaoCyprusCzech RepublicDenmarkDjiboutiDominicaDominican RepublicEarly-demographic dividendEast Asia & PacificEast Asia & Pacific (excluding high income)East Asia & Pacific (IDA & IBRD countries)EcuadorEgypt, Arab Rep.El SalvadorEquatorial GuineaEritreaEstoniaEthiopiaEuro areaEurope & Central AsiaEurope & Central Asia (excluding high income)Europe & Central Asia (IDA & IBRD countries)European UnionFaroe IslandsFijiFinlandFragile and conflict affected situationsFranceFrench PolynesiaGabonGambia, TheGeorgiaGermanyGhanaGibraltarGreeceGreenlandGrenadaGuamGuatemalaGuineaGuinea-BissauGuyanaHaitiHeavily indebted poor countries (HIPC)High incomeHondurasHong Kong SAR, ChinaHungaryIBRD onlyIcelandIDA & IBRD totalIDA blendIDA onlyIDA totalIndiaIndonesiaIran, Islamic Rep.IraqIrelandIsraelItalyJamaicaJapanJordanKazakhstanKenyaKiribatiKorea, Dem. People’s Rep.Korea, Rep.KosovoKuwaitKyrgyz RepublicLao PDRLate-demographic dividendLatin America & Caribbean Latin America & Caribbean (excluding high income)Latin America & the Caribbean (IDA & IBRD countries)LatviaLeast developed countries: UN classificationLebanonLesothoLiberiaLibyaLiechtensteinLithuaniaLow & middle incomeLow incomeLower middle incomeLuxembourgMacao SAR, ChinaMacedonia, FYRMadagascarMalawiMalaysiaMaldivesMaliMaltaMarshall IslandsMauritaniaMauritiusMexicoMicronesia, Fed. Sts.Middle East & North AfricaMiddle East & North Africa (excluding high income)Middle East & North Africa (IDA & IBRD countries)Middle incomeMoldovaMonacoMongoliaMontenegroMoroccoMozambiqueMyanmarNamibiaNauruNepalNetherlandsNew CaledoniaNew ZealandNicaraguaNigerNigeriaNorth AmericaNorthern Mariana IslandsNorwayOECD membersOmanOther small statesPacific island small statesPakistanPalauPanamaPapua New GuineaParaguayPeruPhilippinesPolandPortugalPost-demographic dividendPre-demographic dividendPuerto RicoQatarRomaniaRussian FederationRwandaSamoaSan MarinoSao Tome and PrincipeSaudi ArabiaSenegalSerbiaSeychellesSierra LeoneSingaporeSlovak RepublicSloveniaSmall statesSolomon IslandsSomaliaSouth AfricaSouth AsiaSouth Asia (IDA & IBRD)South SudanSpainSri LankaSt. Kitts and NevisSt. LuciaSt. Vincent and the GrenadinesSub-Saharan Africa Sub-Saharan Africa (excluding high income)Sub-Saharan Africa (IDA & IBRD countries)SudanSurinameSwazilandSwedenSwitzerlandSyrian Arab RepublicTajikistanTanzaniaThailandTimor-LesteTogoTongaTrinidad and TobagoTunisiaTurkeyTurkmenistanTurks and Caicos IslandsTuvaluUgandaUkraineUnited Arab EmiratesUnited KingdomUnited StatesUpper middle incomeUruguayUzbekistanVanuatuVenezuela, RBVietnamVirgin Islands (U.S.)West Bank and GazaWorldYemen, Rep.ZambiaZimbabwe Timeline:
This timeline shows a graph from 1961 to 2016 of Colombia. No data until 1960. Number of actual observations by date: 44.
Source name:
World Development Indicators
Source organization:
International Telecommunication Union, World Telecommunication/ICT Development Report and database, and World Bank estimates.
Categories, topics:
Infrastructure
Last updated:
apr 23, 2017
Indicators value changes by year
Minimum:
274.937K
jan 1, 1961
Maximum:
7.929 mln
jan 1, 2009
At the date of observation
Value
Absolute change
Change from previous value
jan 1, 1961
274.937K
+274.937K
0.0%
jan 1, 1966
393.0K
+118.063K
42.94%
jan 1, 1971
596.0K
+203.0K
51.65%
jan 1, 1976
837.6K
+241.6K
40.54%
jan 1, 1977
861.2K
+23.6K
2.82%
jan 1, 1978
936.6K
+75.4K
8.76%
jan 1, 1979
1.011 mln
+74.2K
7.92%
jan 1, 1980
1.022 mln
+11.5K
1.14%
jan 1, 1981
1.076 mln
+53.4K
5.22%
jan 1, 1982
1.134 mln
+58.76K
5.46%
jan 1, 1983
1.293 mln
+158.57K
13.98%
jan 1, 1984
1.299 mln
+5.813K
0.45%
jan 1, 1985
1.506 mln
+207.584K
15.98%
jan 1, 1986
1.702 mln
+195.864K
13.0%
jan 1, 1987
1.799 mln
+96.502K
5.67%
jan 1, 1988
1.918 mln
+119.504K
6.64%
jan 1, 1989
2.07 mln
+152.063K
7.93%
jan 1, 1990
2.177 mln
+106.181K
5.13%
jan 1, 1991
2.415 mln
+238.185K
10.94%
jan 1, 1992
2.633 mln
+218.547K
9.05%
jan 1, 1993
2.822 mln
+188.427K
7.16%
jan 1, 1994
3.139 mln
+317.768K
11.26%
jan 1, 1995
3.513 mln
+373.532K
11.9%
jan 1, 1996
3.873 mln
+359.845K
10.24%
jan 1, 1997
4.645 mln
+772.608K
19.95%
jan 1, 1998
5.395 mln
+749.304K
16.13%
jan 1, 1999
6.367 mln
+972.187K
18.02%
jan 1, 2000
6.665 mln
+298.478K
4.69%
jan 1, 2001
7.193 mln
+527.356K
7.91%
jan 1, 2002
7.372 mln
+178.767K
2.49%
jan 1, 2003
7.766 mln
+394.455K
5.35%
jan 1, 2004
7.848 mln
+82.266K
1.06%
jan 1, 2005
7.589 mln
-259.59K
-3.31%
jan 1, 2006
7.679 mln
+90.128K
1.19%
jan 1, 2007
7.86 mln
+181.401K
2.36%
jan 1, 2008
7.924 mln
+63.893K
0.81%
jan 1, 2009
7.929 mln
+4.846K
0.06%
jan 1, 2010
7.474 mln
-455.077K
-5.74%
jan 1, 2011
7.186 mln
-287.702K
-3.85%
jan 1, 2012
7.127 mln
-59.435K
-0.83%
jan 1, 2013
7.066 mln
-60.6K
-0.85%
jan 1, 2014
7.141 mln
+75.331K
1.07%
jan 1, 2015
7.181 mln
+39.476K
0.55%
jan 1, 2016
7.109 mln
-71.683K
-1.0%
Ranking of countries by current statistics by years


Comments: