29
/
en
AIzaSyAYiBZKx7MnpbEhh9jyipgxe19OcubqV5w
April 1, 2024
46086
Low income
LIC
false
2
1
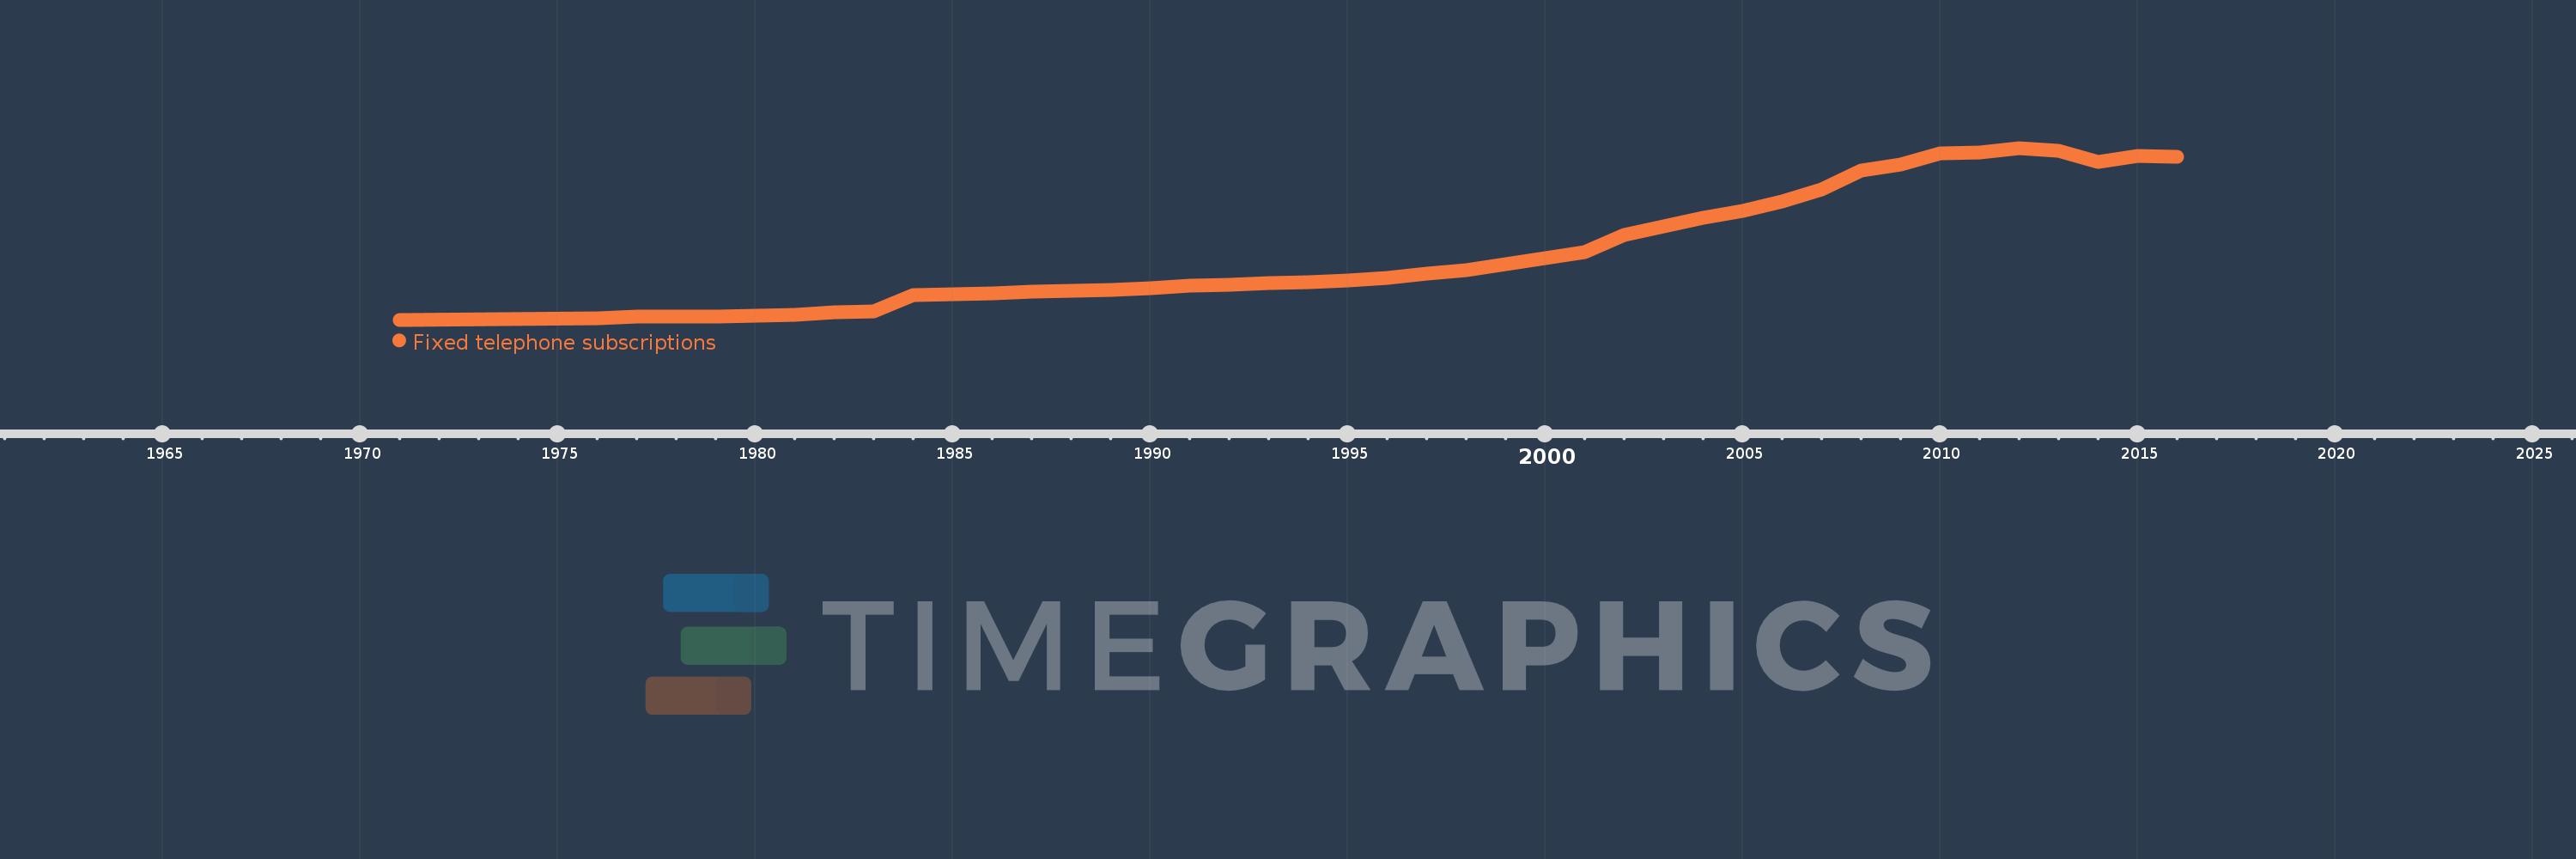
Fixed telephone subscriptions
2016,2015,2014,2013,2012,2011,2010,2009,2008,2007,2006,2005,2004,2003,2002,2001,2000,1999,1998,1997,1996,1995,1994,1993,1992,1991,1990,1989,1988,1987,1986,1985,1984,1983,1982,1981,1980,1979,1978,1977,1976,1971
This statistics in other country:
AfghanistanAlbaniaAlgeriaAmerican SamoaAndorraAngolaAntigua and BarbudaArab WorldArgentinaArmeniaArubaAustraliaAustriaAzerbaijanBahamas, TheBahrainBangladeshBarbadosBelarusBelgiumBelizeBeninBermudaBhutanBoliviaBosnia and HerzegovinaBotswanaBrazilBritish Virgin IslandsBrunei DarussalamBulgariaBurkina FasoBurundiCabo VerdeCambodiaCameroonCanadaCaribbean small statesCayman IslandsCentral African RepublicCentral Europe and the BalticsChadChileChinaColombiaComorosCongo, Dem. Rep.Congo, Rep.Costa RicaCote d'IvoireCroatiaCubaCuracaoCyprusCzech RepublicDenmarkDjiboutiDominicaDominican RepublicEarly-demographic dividendEast Asia & PacificEast Asia & Pacific (excluding high income)East Asia & Pacific (IDA & IBRD countries)EcuadorEgypt, Arab Rep.El SalvadorEquatorial GuineaEritreaEstoniaEthiopiaEuro areaEurope & Central AsiaEurope & Central Asia (excluding high income)Europe & Central Asia (IDA & IBRD countries)European UnionFaroe IslandsFijiFinlandFragile and conflict affected situationsFranceFrench PolynesiaGabonGambia, TheGeorgiaGermanyGhanaGibraltarGreeceGreenlandGrenadaGuamGuatemalaGuineaGuinea-BissauGuyanaHaitiHeavily indebted poor countries (HIPC)High incomeHondurasHong Kong SAR, ChinaHungaryIBRD onlyIcelandIDA & IBRD totalIDA blendIDA onlyIDA totalIndiaIndonesiaIran, Islamic Rep.IraqIrelandIsraelItalyJamaicaJapanJordanKazakhstanKenyaKiribatiKorea, Dem. People’s Rep.Korea, Rep.KosovoKuwaitKyrgyz RepublicLao PDRLate-demographic dividendLatin America & Caribbean Latin America & Caribbean (excluding high income)Latin America & the Caribbean (IDA & IBRD countries)LatviaLeast developed countries: UN classificationLebanonLesothoLiberiaLibyaLiechtensteinLithuaniaLow & middle incomeLow incomeLower middle incomeLuxembourgMacao SAR, ChinaMacedonia, FYRMadagascarMalawiMalaysiaMaldivesMaliMaltaMarshall IslandsMauritaniaMauritiusMexicoMicronesia, Fed. Sts.Middle East & North AfricaMiddle East & North Africa (excluding high income)Middle East & North Africa (IDA & IBRD countries)Middle incomeMoldovaMonacoMongoliaMontenegroMoroccoMozambiqueMyanmarNamibiaNauruNepalNetherlandsNew CaledoniaNew ZealandNicaraguaNigerNigeriaNorth AmericaNorthern Mariana IslandsNorwayOECD membersOmanOther small statesPacific island small statesPakistanPalauPanamaPapua New GuineaParaguayPeruPhilippinesPolandPortugalPost-demographic dividendPre-demographic dividendPuerto RicoQatarRomaniaRussian FederationRwandaSamoaSan MarinoSao Tome and PrincipeSaudi ArabiaSenegalSerbiaSeychellesSierra LeoneSingaporeSlovak RepublicSloveniaSmall statesSolomon IslandsSomaliaSouth AfricaSouth AsiaSouth Asia (IDA & IBRD)South SudanSpainSri LankaSt. Kitts and NevisSt. LuciaSt. Vincent and the GrenadinesSub-Saharan Africa Sub-Saharan Africa (excluding high income)Sub-Saharan Africa (IDA & IBRD countries)SudanSurinameSwazilandSwedenSwitzerlandSyrian Arab RepublicTajikistanTanzaniaThailandTimor-LesteTogoTongaTrinidad and TobagoTunisiaTurkeyTurkmenistanTurks and Caicos IslandsTuvaluUgandaUkraineUnited Arab EmiratesUnited KingdomUnited StatesUpper middle incomeUruguayUzbekistanVanuatuVenezuela, RBVietnamVirgin Islands (U.S.)West Bank and GazaWorldYemen, Rep.ZambiaZimbabwe Timeline:
This timeline shows a graph from 1971 to 2016 of Low income. No data until 1970. Number of actual observations by date: 42.
Source name:
World Development Indicators
Source organization:
International Telecommunication Union, World Telecommunication/ICT Development Report and database, and World Bank estimates.
Categories, topics:
Infrastructure
Last updated:
apr 23, 2017
Indicators value changes by year
Minimum:
252.959K
jan 1, 1971
Maximum:
5.716 mln
jan 1, 2012
At the date of observation
Value
Absolute change
Change from previous value
jan 1, 1971
252.959K
+252.959K
0.0%
jan 1, 1976
307.81K
+54.851K
21.68%
jan 1, 1977
348.419K
+40.609K
13.19%
jan 1, 1978
360.411K
+11.992K
3.44%
jan 1, 1979
357.584K
-2.827K
-0.78%
jan 1, 1980
384.644K
+27.06K
7.57%
jan 1, 1981
413.011K
+28.367K
7.37%
jan 1, 1982
488.93K
+75.919K
18.38%
jan 1, 1983
513.362K
+24.432K
5.0%
jan 1, 1984
1.044 mln
+530.591K
103.36%
jan 1, 1985
1.074 mln
+29.578K
2.83%
jan 1, 1986
1.103 mln
+29.416K
2.74%
jan 1, 1987
1.147 mln
+44.357K
4.02%
jan 1, 1988
1.18 mln
+33.017K
2.88%
jan 1, 1989
1.211 mln
+30.607K
2.59%
jan 1, 1990
1.265 mln
+54.498K
4.5%
jan 1, 1991
1.326 mln
+60.633K
4.79%
jan 1, 1992
1.372 mln
+46.201K
3.48%
jan 1, 1993
1.416 mln
+44.042K
3.21%
jan 1, 1994
1.444 mln
+27.218K
1.92%
jan 1, 1995
1.505 mln
+61.249K
4.24%
jan 1, 1996
1.59 mln
+85.539K
5.68%
jan 1, 1997
1.708 mln
+117.483K
7.39%
jan 1, 1998
1.829 mln
+120.842K
7.08%
jan 1, 1999
2.02 mln
+191.303K
10.46%
jan 1, 2000
2.21 mln
+189.82K
9.4%
jan 1, 2001
2.409 mln
+198.975K
9.0%
jan 1, 2002
2.961 mln
+552.337K
22.93%
jan 1, 2003
3.23 mln
+268.822K
9.08%
jan 1, 2004
3.508 mln
+277.98K
8.61%
jan 1, 2005
3.709 mln
+201.119K
5.73%
jan 1, 2006
4.014 mln
+305.057K
8.22%
jan 1, 2007
4.404 mln
+390.179K
9.72%
jan 1, 2008
5.007 mln
+602.444K
13.68%
jan 1, 2009
5.186 mln
+179.148K
3.58%
jan 1, 2010
5.548 mln
+362.179K
6.98%
jan 1, 2011
5.57 mln
+22.458K
0.4%
jan 1, 2012
5.716 mln
+145.047K
2.6%
jan 1, 2013
5.613 mln
-102.49K
-1.79%
jan 1, 2014
5.275 mln
-338.124K
-6.02%
jan 1, 2015
5.454 mln
+178.656K
3.39%
jan 1, 2016
5.432 mln
-21.217K
-0.39%
Ranking of countries by current statistics by years


Comments: