29
/
en
AIzaSyAYiBZKx7MnpbEhh9jyipgxe19OcubqV5w
April 1, 2024
142527
Greenland
GRL
true
2
1
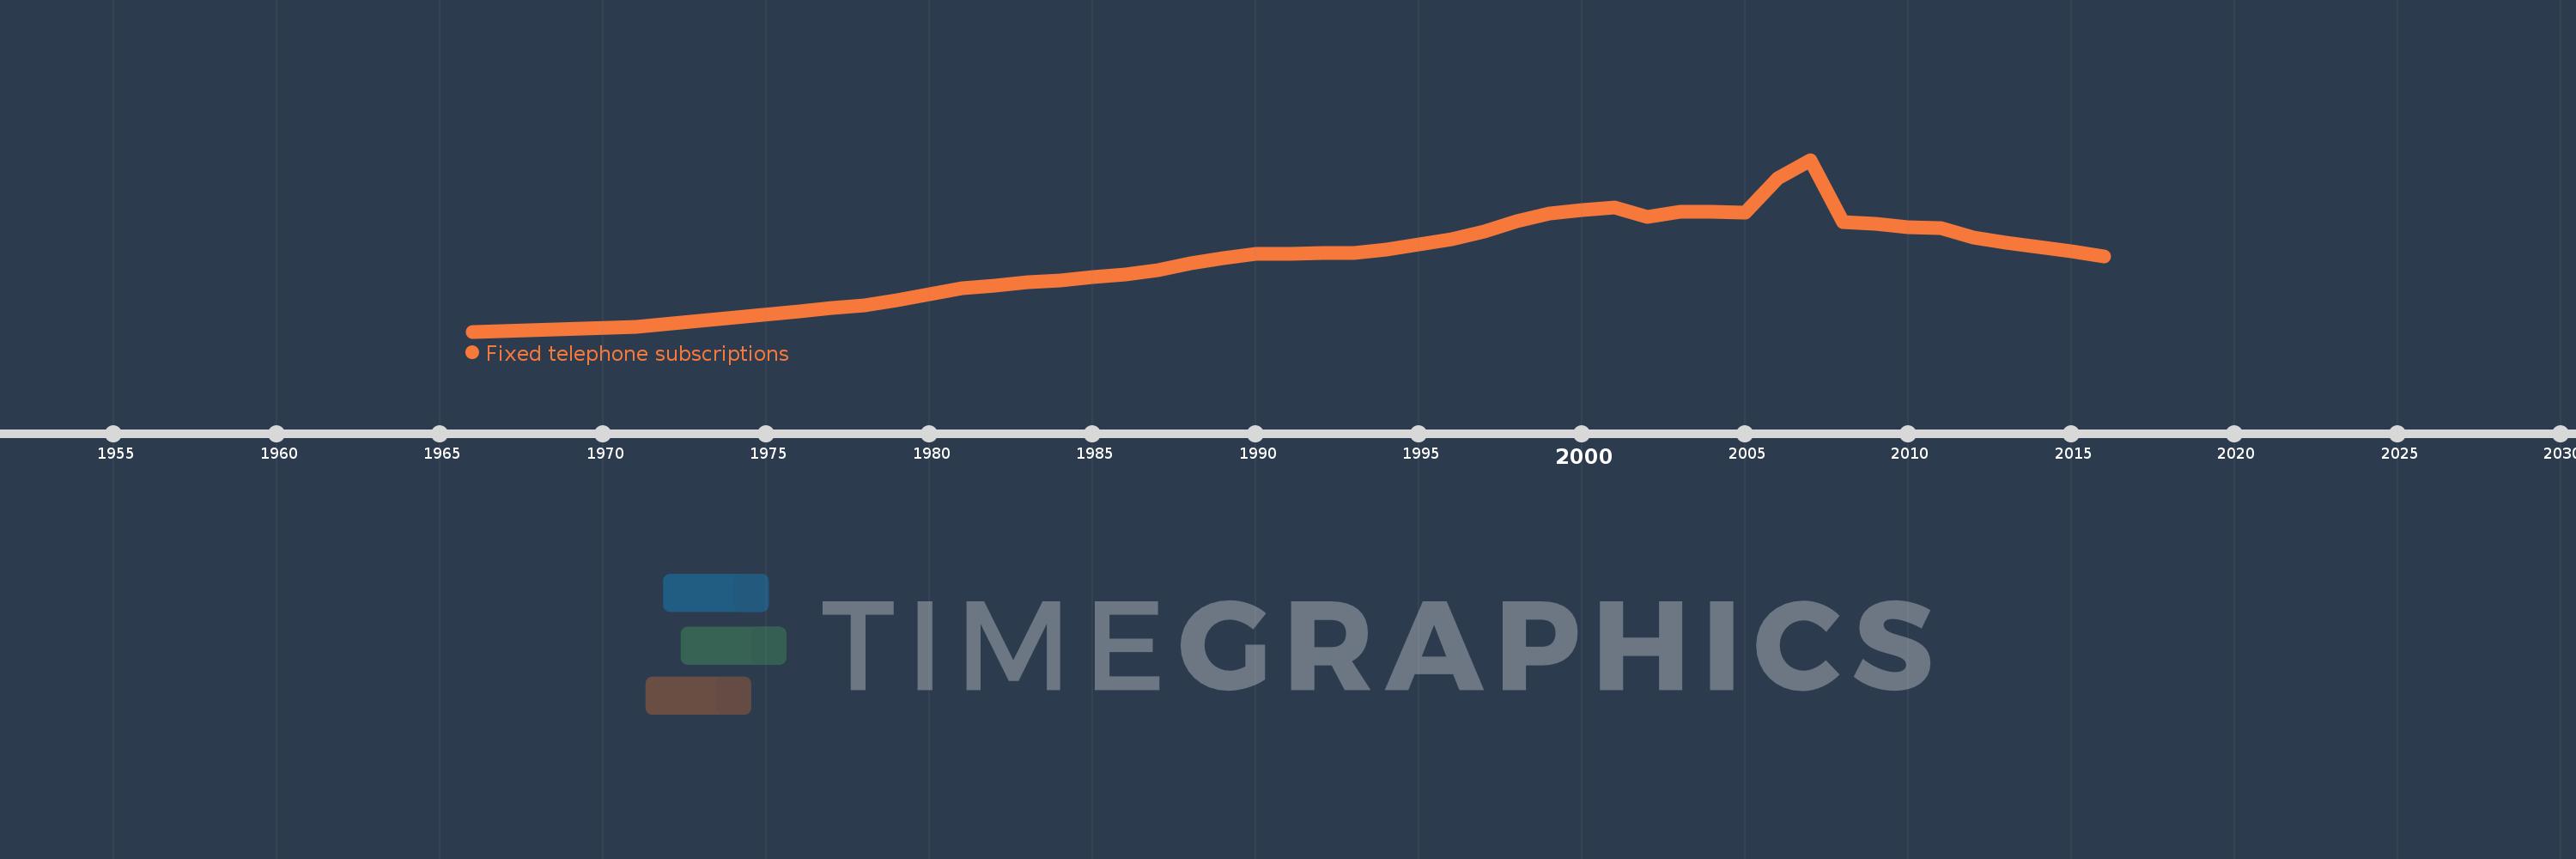
Fixed telephone subscriptions
2016,2015,2014,2013,2012,2011,2010,2009,2008,2007,2006,2005,2004,2003,2002,2001,2000,1999,1998,1997,1996,1995,1994,1993,1992,1991,1990,1989,1988,1987,1986,1985,1984,1983,1982,1981,1980,1979,1978,1977,1976,1971,1966
This statistics in other country:
AfghanistanAlbaniaAlgeriaAmerican SamoaAndorraAngolaAntigua and BarbudaArab WorldArgentinaArmeniaArubaAustraliaAustriaAzerbaijanBahamas, TheBahrainBangladeshBarbadosBelarusBelgiumBelizeBeninBermudaBhutanBoliviaBosnia and HerzegovinaBotswanaBrazilBritish Virgin IslandsBrunei DarussalamBulgariaBurkina FasoBurundiCabo VerdeCambodiaCameroonCanadaCaribbean small statesCayman IslandsCentral African RepublicCentral Europe and the BalticsChadChileChinaColombiaComorosCongo, Dem. Rep.Congo, Rep.Costa RicaCote d'IvoireCroatiaCubaCuracaoCyprusCzech RepublicDenmarkDjiboutiDominicaDominican RepublicEarly-demographic dividendEast Asia & PacificEast Asia & Pacific (excluding high income)East Asia & Pacific (IDA & IBRD countries)EcuadorEgypt, Arab Rep.El SalvadorEquatorial GuineaEritreaEstoniaEthiopiaEuro areaEurope & Central AsiaEurope & Central Asia (excluding high income)Europe & Central Asia (IDA & IBRD countries)European UnionFaroe IslandsFijiFinlandFragile and conflict affected situationsFranceFrench PolynesiaGabonGambia, TheGeorgiaGermanyGhanaGibraltarGreeceGreenlandGrenadaGuamGuatemalaGuineaGuinea-BissauGuyanaHaitiHeavily indebted poor countries (HIPC)High incomeHondurasHong Kong SAR, ChinaHungaryIBRD onlyIcelandIDA & IBRD totalIDA blendIDA onlyIDA totalIndiaIndonesiaIran, Islamic Rep.IraqIrelandIsraelItalyJamaicaJapanJordanKazakhstanKenyaKiribatiKorea, Dem. People’s Rep.Korea, Rep.KosovoKuwaitKyrgyz RepublicLao PDRLate-demographic dividendLatin America & Caribbean Latin America & Caribbean (excluding high income)Latin America & the Caribbean (IDA & IBRD countries)LatviaLeast developed countries: UN classificationLebanonLesothoLiberiaLibyaLiechtensteinLithuaniaLow & middle incomeLow incomeLower middle incomeLuxembourgMacao SAR, ChinaMacedonia, FYRMadagascarMalawiMalaysiaMaldivesMaliMaltaMarshall IslandsMauritaniaMauritiusMexicoMicronesia, Fed. Sts.Middle East & North AfricaMiddle East & North Africa (excluding high income)Middle East & North Africa (IDA & IBRD countries)Middle incomeMoldovaMonacoMongoliaMontenegroMoroccoMozambiqueMyanmarNamibiaNauruNepalNetherlandsNew CaledoniaNew ZealandNicaraguaNigerNigeriaNorth AmericaNorthern Mariana IslandsNorwayOECD membersOmanOther small statesPacific island small statesPakistanPalauPanamaPapua New GuineaParaguayPeruPhilippinesPolandPortugalPost-demographic dividendPre-demographic dividendPuerto RicoQatarRomaniaRussian FederationRwandaSamoaSan MarinoSao Tome and PrincipeSaudi ArabiaSenegalSerbiaSeychellesSierra LeoneSingaporeSlovak RepublicSloveniaSmall statesSolomon IslandsSomaliaSouth AfricaSouth AsiaSouth Asia (IDA & IBRD)South SudanSpainSri LankaSt. Kitts and NevisSt. LuciaSt. Vincent and the GrenadinesSub-Saharan Africa Sub-Saharan Africa (excluding high income)Sub-Saharan Africa (IDA & IBRD countries)SudanSurinameSwazilandSwedenSwitzerlandSyrian Arab RepublicTajikistanTanzaniaThailandTimor-LesteTogoTongaTrinidad and TobagoTunisiaTurkeyTurkmenistanTurks and Caicos IslandsTuvaluUgandaUkraineUnited Arab EmiratesUnited KingdomUnited StatesUpper middle incomeUruguayUzbekistanVanuatuVenezuela, RBVietnamVirgin Islands (U.S.)West Bank and GazaWorldYemen, Rep.ZambiaZimbabwe Timeline:
This timeline shows a graph from 1966 to 2016 of Greenland. No data until 1965. Number of actual observations by date: 43.
Source name:
World Development Indicators
Source organization:
International Telecommunication Union, World Telecommunication/ICT Development Report and database, and World Bank estimates.
Categories, topics:
Infrastructure
Last updated:
apr 23, 2017
Indicators value changes by year
Maximum:
35.983K
jan 1, 2007
At the date of observation
Value
Absolute change
Change from previous value
jan 1, 1966
580.0
+580.0
0.0%
jan 1, 1971
1.56K
+980.0
168.97%
jan 1, 1976
4.673K
+3.113K
199.55%
jan 1, 1977
5.454K
+781.0
16.71%
jan 1, 1978
5.993K
+539.0
9.88%
jan 1, 1979
7.113K
+1.12K
18.69%
jan 1, 1980
8.337K
+1.224K
17.21%
jan 1, 1981
9.559K
+1.222K
14.66%
jan 1, 1982
10.103K
+544.0
5.69%
jan 1, 1983
10.721K
+618.0
6.12%
jan 1, 1984
11.06K
+339.0
3.16%
jan 1, 1985
11.77K
+710.0
6.42%
jan 1, 1986
12.325K
+555.0
4.72%
jan 1, 1987
13.3K
+975.0
7.91%
jan 1, 1988
14.729K
+1.429K
10.74%
jan 1, 1989
15.757K
+1.028K
6.98%
jan 1, 1990
16.561K
+804.0
5.1%
jan 1, 1991
16.605K
+44.0
0.27%
jan 1, 1992
16.77K
+165.0
0.99%
jan 1, 1993
16.86K
+90.0
0.54%
jan 1, 1994
17.555K
+695.0
4.12%
jan 1, 1995
18.475K
+920.0
5.24%
jan 1, 1996
19.599K
+1.124K
6.08%
jan 1, 1997
21.116K
+1.517K
7.74%
jan 1, 1998
23.361K
+2.245K
10.63%
jan 1, 1999
24.968K
+1.607K
6.88%
jan 1, 2000
25.617K
+649.0
2.6%
jan 1, 2001
26.18K
+563.0
2.2%
jan 1, 2002
24.217K
-1.963K
-7.5%
jan 1, 2003
25.33K
+1.113K
4.6%
jan 1, 2004
25.248K
-82.0
-0.32%
jan 1, 2005
25.128K
-120.0
-0.48%
jan 1, 2006
32.151K
+7.023K
27.95%
jan 1, 2007
35.983K
+3.832K
11.92%
jan 1, 2008
23.159K
-12.824K
-35.64%
jan 1, 2009
22.818K
-341.0
-1.47%
jan 1, 2010
22.04K
-778.0
-3.41%
jan 1, 2011
21.822K
-218.0
-0.99%
jan 1, 2012
19.896K
-1.926K
-8.83%
jan 1, 2013
18.91K
-986.0
-4.96%
jan 1, 2014
18.0K
-910.0
-4.81%
jan 1, 2015
17.2K
-800.0
-4.44%
jan 1, 2016
16.0K
-1.2K
-6.98%
Ranking of countries by current statistics by years


Comments: