29
/
en
AIzaSyAYiBZKx7MnpbEhh9jyipgxe19OcubqV5w
April 1, 2024
223538
Philippines
PHL
true
2
1
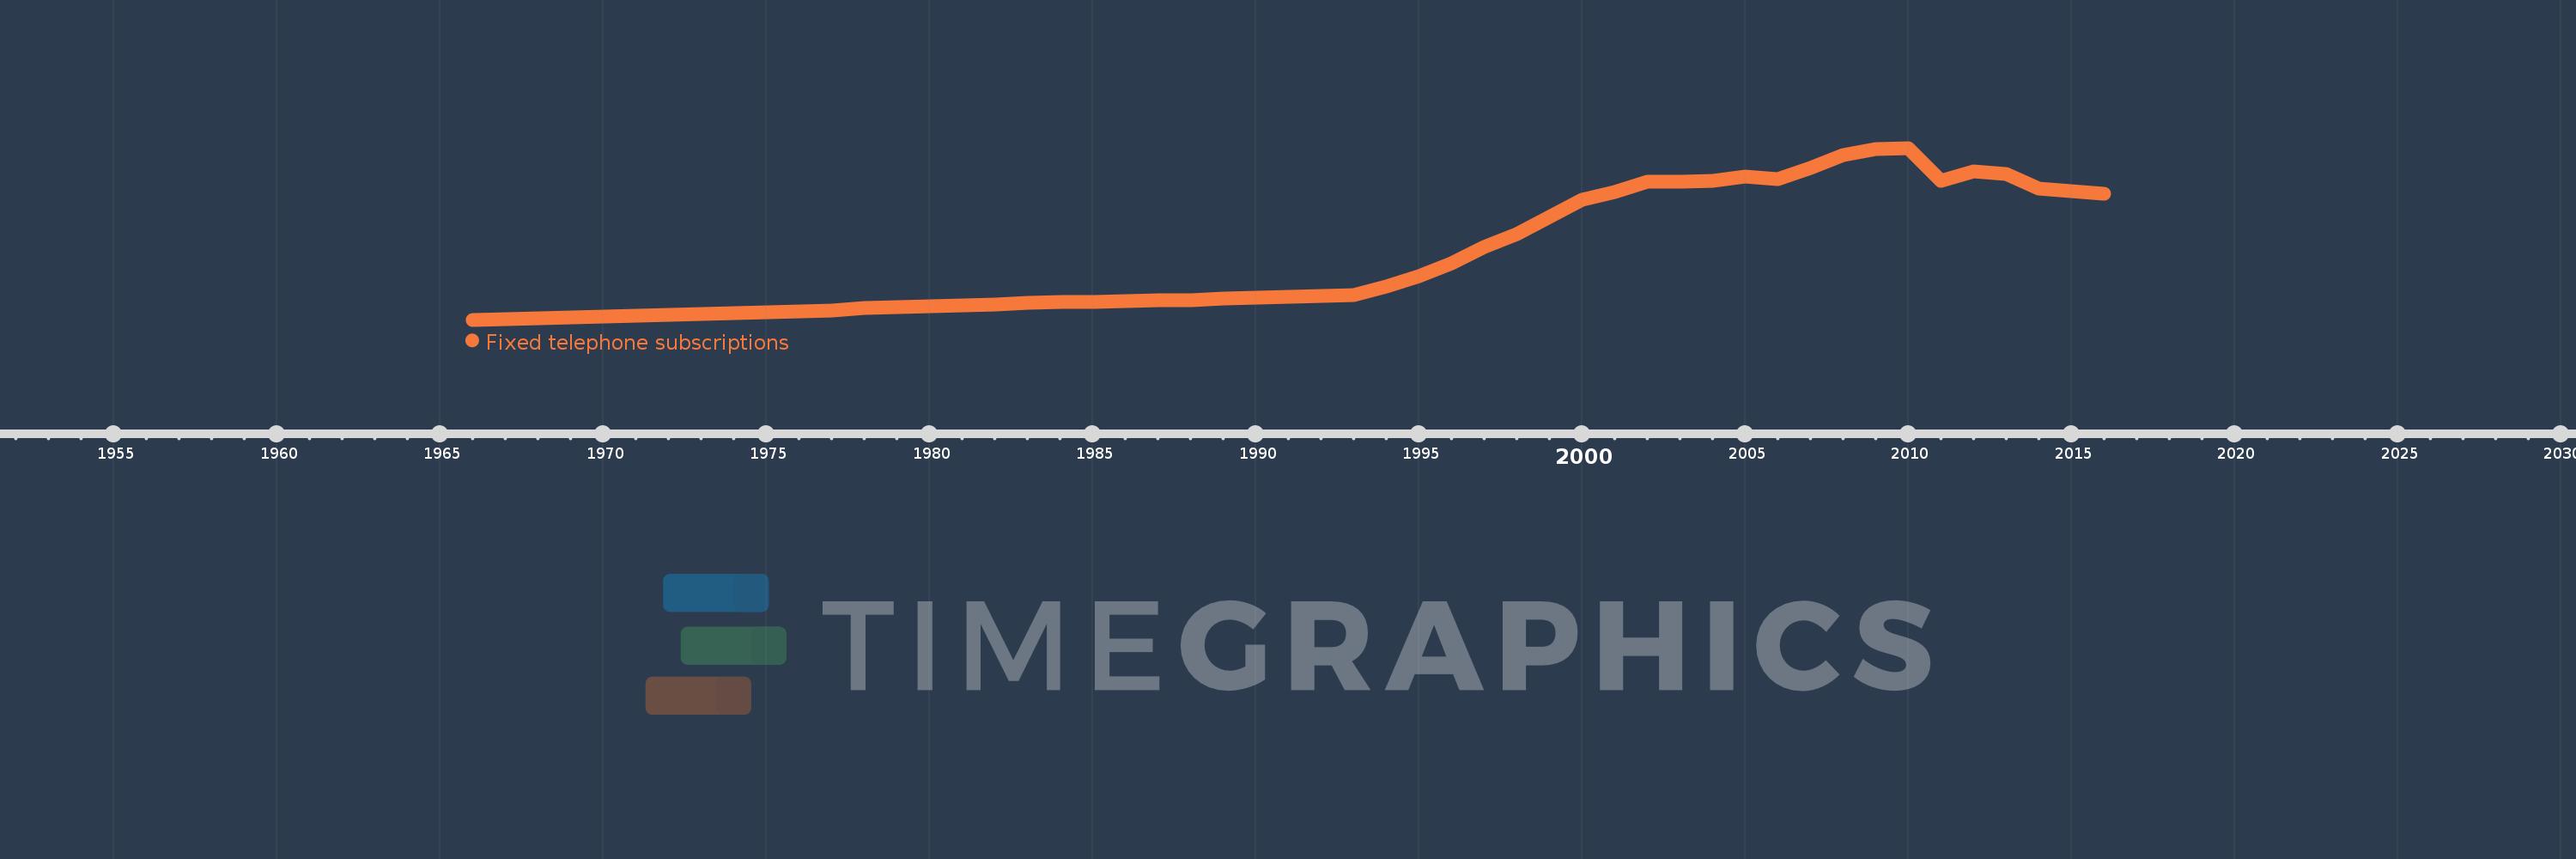
Fixed telephone subscriptions
2016,2015,2014,2013,2012,2011,2010,2009,2008,2007,2006,2005,2004,2003,2002,2001,2000,1999,1998,1997,1996,1995,1994,1993,1992,1991,1990,1989,1988,1987,1986,1985,1984,1983,1982,1981,1980,1979,1978,1977,1976,1971,1966
This statistics in other country:
AfghanistanAlbaniaAlgeriaAmerican SamoaAndorraAngolaAntigua and BarbudaArab WorldArgentinaArmeniaArubaAustraliaAustriaAzerbaijanBahamas, TheBahrainBangladeshBarbadosBelarusBelgiumBelizeBeninBermudaBhutanBoliviaBosnia and HerzegovinaBotswanaBrazilBritish Virgin IslandsBrunei DarussalamBulgariaBurkina FasoBurundiCabo VerdeCambodiaCameroonCanadaCaribbean small statesCayman IslandsCentral African RepublicCentral Europe and the BalticsChadChileChinaColombiaComorosCongo, Dem. Rep.Congo, Rep.Costa RicaCote d'IvoireCroatiaCubaCuracaoCyprusCzech RepublicDenmarkDjiboutiDominicaDominican RepublicEarly-demographic dividendEast Asia & PacificEast Asia & Pacific (excluding high income)East Asia & Pacific (IDA & IBRD countries)EcuadorEgypt, Arab Rep.El SalvadorEquatorial GuineaEritreaEstoniaEthiopiaEuro areaEurope & Central AsiaEurope & Central Asia (excluding high income)Europe & Central Asia (IDA & IBRD countries)European UnionFaroe IslandsFijiFinlandFragile and conflict affected situationsFranceFrench PolynesiaGabonGambia, TheGeorgiaGermanyGhanaGibraltarGreeceGreenlandGrenadaGuamGuatemalaGuineaGuinea-BissauGuyanaHaitiHeavily indebted poor countries (HIPC)High incomeHondurasHong Kong SAR, ChinaHungaryIBRD onlyIcelandIDA & IBRD totalIDA blendIDA onlyIDA totalIndiaIndonesiaIran, Islamic Rep.IraqIrelandIsraelItalyJamaicaJapanJordanKazakhstanKenyaKiribatiKorea, Dem. People’s Rep.Korea, Rep.KosovoKuwaitKyrgyz RepublicLao PDRLate-demographic dividendLatin America & Caribbean Latin America & Caribbean (excluding high income)Latin America & the Caribbean (IDA & IBRD countries)LatviaLeast developed countries: UN classificationLebanonLesothoLiberiaLibyaLiechtensteinLithuaniaLow & middle incomeLow incomeLower middle incomeLuxembourgMacao SAR, ChinaMacedonia, FYRMadagascarMalawiMalaysiaMaldivesMaliMaltaMarshall IslandsMauritaniaMauritiusMexicoMicronesia, Fed. Sts.Middle East & North AfricaMiddle East & North Africa (excluding high income)Middle East & North Africa (IDA & IBRD countries)Middle incomeMoldovaMonacoMongoliaMontenegroMoroccoMozambiqueMyanmarNamibiaNauruNepalNetherlandsNew CaledoniaNew ZealandNicaraguaNigerNigeriaNorth AmericaNorthern Mariana IslandsNorwayOECD membersOmanOther small statesPacific island small statesPakistanPalauPanamaPapua New GuineaParaguayPeruPhilippinesPolandPortugalPost-demographic dividendPre-demographic dividendPuerto RicoQatarRomaniaRussian FederationRwandaSamoaSan MarinoSao Tome and PrincipeSaudi ArabiaSenegalSerbiaSeychellesSierra LeoneSingaporeSlovak RepublicSloveniaSmall statesSolomon IslandsSomaliaSouth AfricaSouth AsiaSouth Asia (IDA & IBRD)South SudanSpainSri LankaSt. Kitts and NevisSt. LuciaSt. Vincent and the GrenadinesSub-Saharan Africa Sub-Saharan Africa (excluding high income)Sub-Saharan Africa (IDA & IBRD countries)SudanSurinameSwazilandSwedenSwitzerlandSyrian Arab RepublicTajikistanTanzaniaThailandTimor-LesteTogoTongaTrinidad and TobagoTunisiaTurkeyTurkmenistanTurks and Caicos IslandsTuvaluUgandaUkraineUnited Arab EmiratesUnited KingdomUnited StatesUpper middle incomeUruguayUzbekistanVanuatuVenezuela, RBVietnamVirgin Islands (U.S.)West Bank and GazaWorldYemen, Rep.ZambiaZimbabwe Timeline:
This timeline shows a graph from 1966 to 2016 of Philippines. No data until 1965. Number of actual observations by date: 43.
Source name:
World Development Indicators
Source organization:
International Telecommunication Union, World Telecommunication/ICT Development Report and database, and World Bank estimates.
Categories, topics:
Infrastructure
Last updated:
apr 23, 2017
Indicators value changes by year
Maximum:
4.1 mln
jan 1, 2010
At the date of observation
Value
Absolute change
Change from previous value
jan 1, 1966
83.0K
+83.0K
0.0%
jan 1, 1971
177.0K
+94.0K
113.25%
jan 1, 1976
284.0K
+107.0K
60.45%
jan 1, 1977
304.0K
+20.0K
7.04%
jan 1, 1978
364.0K
+60.0K
19.74%
jan 1, 1979
371.0K
+7.0K
1.92%
jan 1, 1980
389.0K
+18.0K
4.85%
jan 1, 1981
420.0K
+31.0K
7.97%
jan 1, 1982
442.84K
+22.84K
5.44%
jan 1, 1983
480.74K
+37.9K
8.56%
jan 1, 1984
490.355K
+9.615K
2.0%
jan 1, 1985
505.065K
+14.71K
3.0%
jan 1, 1986
510.268K
+5.203K
1.03%
jan 1, 1987
535.303K
+25.035K
4.91%
jan 1, 1988
546.017K
+10.714K
2.0%
jan 1, 1989
570.643K
+24.626K
4.51%
jan 1, 1990
591.248K
+20.605K
3.61%
jan 1, 1991
610.032K
+18.784K
3.18%
jan 1, 1992
647.939K
+37.907K
6.21%
jan 1, 1993
660.587K
+12.648K
1.95%
jan 1, 1994
859.762K
+199.175K
30.15%
jan 1, 1995
1.11 mln
+249.89K
29.07%
jan 1, 1996
1.41 mln
+299.987K
27.03%
jan 1, 1997
1.787 mln
+377.361K
26.77%
jan 1, 1998
2.078 mln
+291.0K
16.28%
jan 1, 1999
2.492 mln
+413.605K
19.9%
jan 1, 2000
2.892 mln
+400.83K
16.09%
jan 1, 2001
3.061 mln
+168.952K
5.84%
jan 1, 2002
3.315 mln
+253.704K
8.29%
jan 1, 2003
3.311 mln
-4.158K
-0.13%
jan 1, 2004
3.34 mln
+29.067K
0.88%
jan 1, 2005
3.437 mln
+97.491K
2.92%
jan 1, 2006
3.367 mln
-70.239K
-2.04%
jan 1, 2007
3.633 mln
+265.936K
7.9%
jan 1, 2008
3.94 mln
+306.894K
8.45%
jan 1, 2009
4.076 mln
+136.058K
3.45%
jan 1, 2010
4.1 mln
+23.86K
0.59%
jan 1, 2011
3.335 mln
-764.602K
-18.65%
jan 1, 2012
3.556 mln
+220.553K
6.61%
jan 1, 2013
3.493 mln
-62.787K
-1.77%
jan 1, 2014
3.149 mln
-344.329K
-9.86%
jan 1, 2015
3.093 mln
-55.599K
-1.77%
jan 1, 2016
3.039 mln
-54.236K
-1.75%
Ranking of countries by current statistics by years


Comments: