29
/fr/
fr
AIzaSyAYiBZKx7MnpbEhh9jyipgxe19OcubqV5w
April 1, 2024
31568
Europe & Central Asia (excluding high income)
ECA
false
2
1
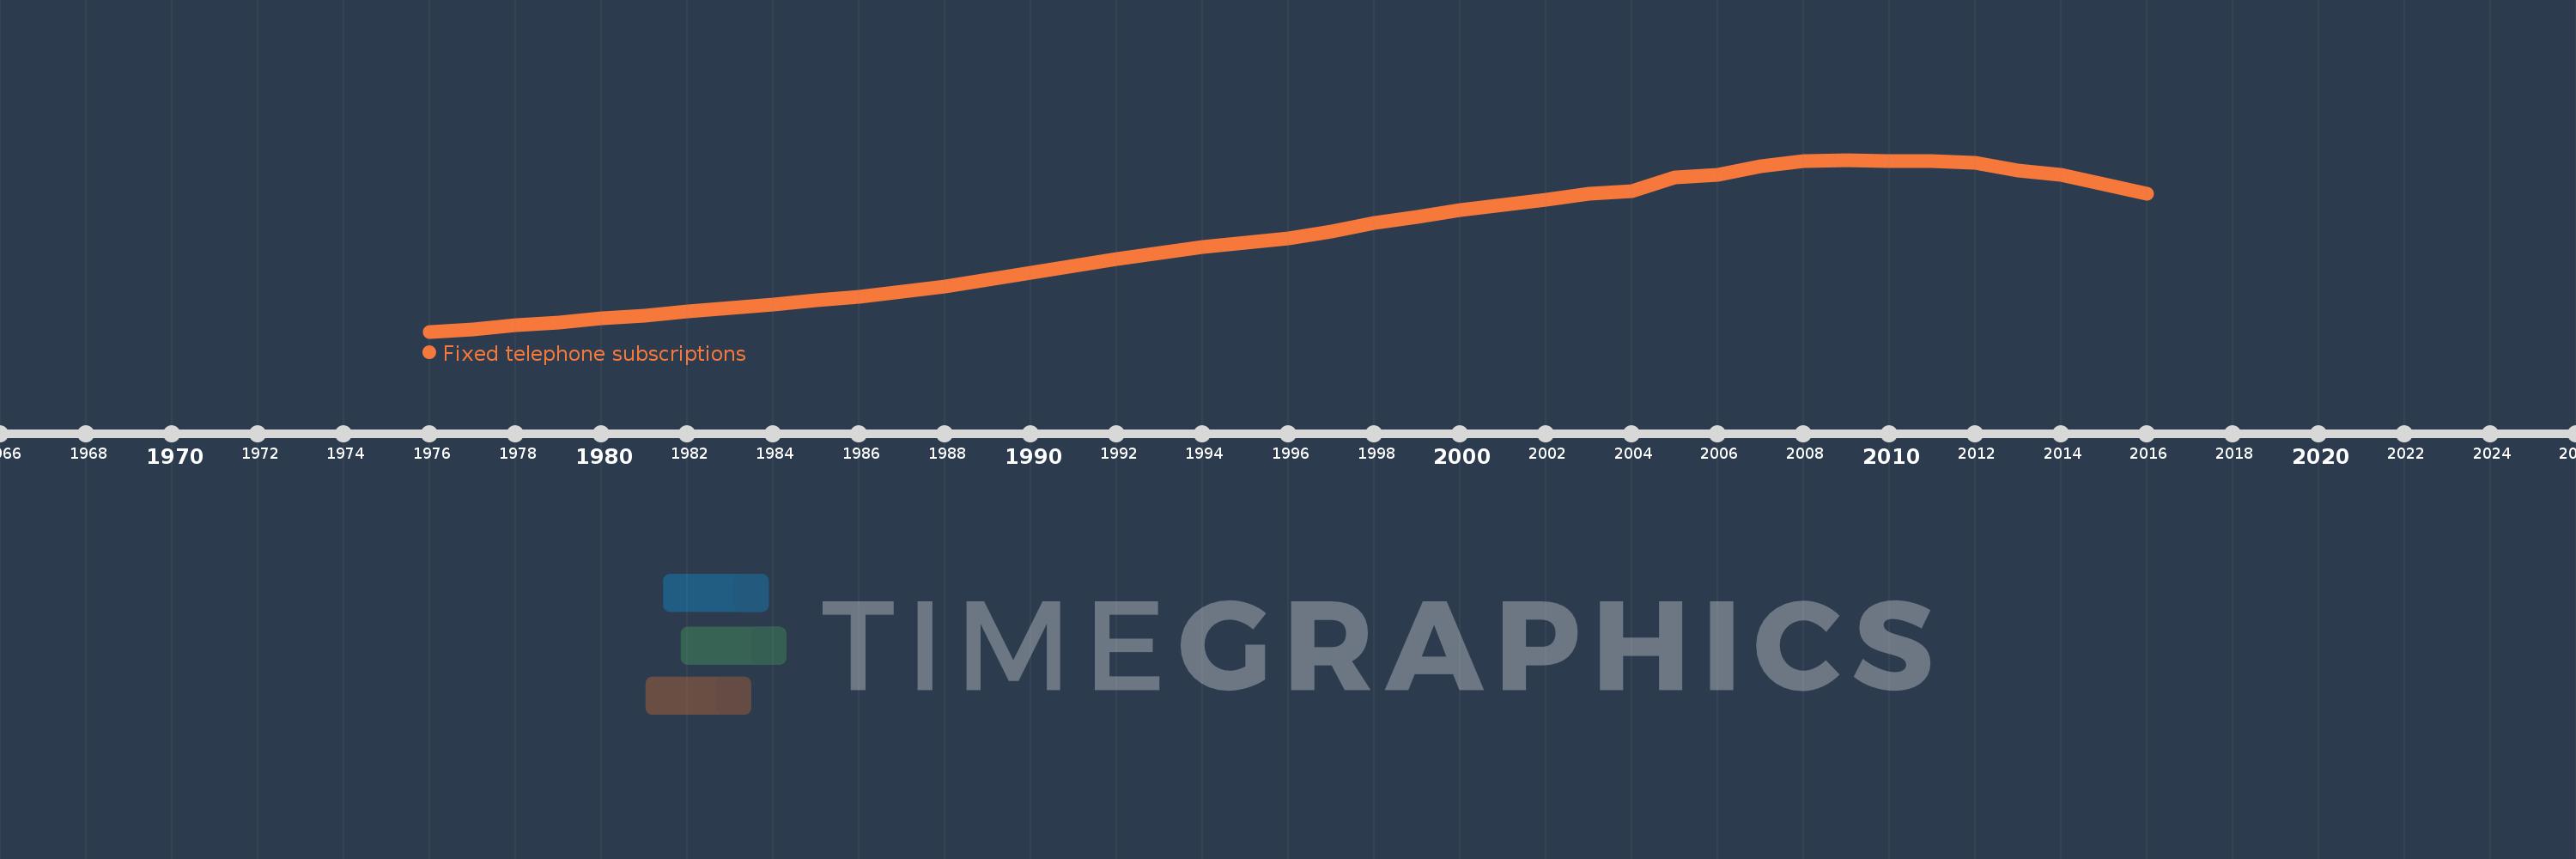
Fixed telephone subscriptions
2016,2015,2014,2013,2012,2011,2010,2009,2008,2007,2006,2005,2004,2003,2002,2001,2000,1999,1998,1997,1996,1995,1994,1993,1992,1991,1990,1989,1988,1987,1986,1985,1984,1983,1982,1981,1980,1979,1978,1977,1976
Cette statistique dans les autres pays:
AfghanistanAlbaniaAlgeriaAmerican SamoaAndorraAngolaAntigua and BarbudaArab WorldArgentinaArmeniaArubaAustraliaAustriaAzerbaijanBahamas, TheBahrainBangladeshBarbadosBelarusBelgiumBelizeBeninBermudaBhutanBoliviaBosnia and HerzegovinaBotswanaBrazilBritish Virgin IslandsBrunei DarussalamBulgariaBurkina FasoBurundiCabo VerdeCambodiaCameroonCanadaCaribbean small statesCayman IslandsCentral African RepublicCentral Europe and the BalticsChadChileChinaColombiaComorosCongo, Dem. Rep.Congo, Rep.Costa RicaCote d'IvoireCroatiaCubaCuracaoCyprusCzech RepublicDenmarkDjiboutiDominicaDominican RepublicEarly-demographic dividendEast Asia & PacificEast Asia & Pacific (excluding high income)East Asia & Pacific (IDA & IBRD countries)EcuadorEgypt, Arab Rep.El SalvadorEquatorial GuineaEritreaEstoniaEthiopiaEuro areaEurope & Central AsiaEurope & Central Asia (excluding high income)Europe & Central Asia (IDA & IBRD countries)European UnionFaroe IslandsFijiFinlandFragile and conflict affected situationsFranceFrench PolynesiaGabonGambia, TheGeorgiaGermanyGhanaGibraltarGreeceGreenlandGrenadaGuamGuatemalaGuineaGuinea-BissauGuyanaHaitiHeavily indebted poor countries (HIPC)High incomeHondurasHong Kong SAR, ChinaHungaryIBRD onlyIcelandIDA & IBRD totalIDA blendIDA onlyIDA totalIndiaIndonesiaIran, Islamic Rep.IraqIrelandIsraelItalyJamaicaJapanJordanKazakhstanKenyaKiribatiKorea, Dem. People’s Rep.Korea, Rep.KosovoKuwaitKyrgyz RepublicLao PDRLate-demographic dividendLatin America & Caribbean Latin America & Caribbean (excluding high income)Latin America & the Caribbean (IDA & IBRD countries)LatviaLeast developed countries: UN classificationLebanonLesothoLiberiaLibyaLiechtensteinLithuaniaLow & middle incomeLow incomeLower middle incomeLuxembourgMacao SAR, ChinaMacedonia, FYRMadagascarMalawiMalaysiaMaldivesMaliMaltaMarshall IslandsMauritaniaMauritiusMexicoMicronesia, Fed. Sts.Middle East & North AfricaMiddle East & North Africa (excluding high income)Middle East & North Africa (IDA & IBRD countries)Middle incomeMoldovaMonacoMongoliaMontenegroMoroccoMozambiqueMyanmarNamibiaNauruNepalNetherlandsNew CaledoniaNew ZealandNicaraguaNigerNigeriaNorth AmericaNorthern Mariana IslandsNorwayOECD membersOmanOther small statesPacific island small statesPakistanPalauPanamaPapua New GuineaParaguayPeruPhilippinesPolandPortugalPost-demographic dividendPre-demographic dividendPuerto RicoQatarRomaniaRussian FederationRwandaSamoaSan MarinoSao Tome and PrincipeSaudi ArabiaSenegalSerbiaSeychellesSierra LeoneSingaporeSlovak RepublicSloveniaSmall statesSolomon IslandsSomaliaSouth AfricaSouth AsiaSouth Asia (IDA & IBRD)South SudanSpainSri LankaSt. Kitts and NevisSt. LuciaSt. Vincent and the GrenadinesSub-Saharan Africa Sub-Saharan Africa (excluding high income)Sub-Saharan Africa (IDA & IBRD countries)SudanSurinameSwazilandSwedenSwitzerlandSyrian Arab RepublicTajikistanTanzaniaThailandTimor-LesteTogoTongaTrinidad and TobagoTunisiaTurkeyTurkmenistanTurks and Caicos IslandsTuvaluUgandaUkraineUnited Arab EmiratesUnited KingdomUnited StatesUpper middle incomeUruguayUzbekistanVanuatuVenezuela, RBVietnamVirgin Islands (U.S.)West Bank and GazaWorldYemen, Rep.ZambiaZimbabwe La ligne de temps
Cette échelle de temps montre un graphique de 1976 année à 2016 année Europe & Central Asia (excluding high income). Les données jusqu'à 1975 année ne sont pas présentés. Quantité d'observations actuelles selon dates: 41.
Source (désignation):
Les indicateurs du développement mondiale
Source (organisation):
International Telecommunication Union, World Telecommunication/ICT Development Report and database, and World Bank estimates.
Catégories:
Infrastructure
Dernière mise à jour
23 avr. 2017
Les indicateurs de changement de valeurs selon les années
Minimum:
12.533 mln.
1 janv. 1976
Maximum:
102.31 mln.
1 janv. 2009
Pour la date d''observation
Valeur
Changement absolu
Le changement par rapport à la valeur précédente
1 janv. 1976
12.533 mln.
+12.533 mln.
0.0%
1 janv. 1977
13.816 mln.
+1.283 mln.
10.24%
1 janv. 1978
15.739 mln.
+1.923 mln.
13.92%
1 janv. 1979
17.16 mln.
+1.421 mln.
9.03%
1 janv. 1980
19.503 mln.
+2.342 mln.
13.65%
1 janv. 1981
20.726 mln.
+1.224 mln.
6.28%
1 janv. 1982
23.048 mln.
+2.322 mln.
11.2%
1 janv. 1983
24.655 mln.
+1.607 mln.
6.97%
1 janv. 1984
26.759 mln.
+2.104 mln.
8.53%
1 janv. 1985
28.737 mln.
+1.978 mln.
7.39%
1 janv. 1986
30.79 mln.
+2.053 mln.
7.14%
1 janv. 1987
33.291 mln.
+2.501 mln.
8.12%
1 janv. 1988
36.302 mln.
+3.01 mln.
9.04%
1 janv. 1989
39.87 mln.
+3.569 mln.
9.83%
1 janv. 1990
43.311 mln.
+3.44 mln.
8.63%
1 janv. 1991
46.723 mln.
+3.413 mln.
7.88%
1 janv. 1992
50.403 mln.
+3.68 mln.
7.88%
1 janv. 1993
53.609 mln.
+3.205 mln.
6.36%
1 janv. 1994
56.742 mln.
+3.133 mln.
5.85%
1 janv. 1995
58.937 mln.
+2.195 mln.
3.87%
1 janv. 1996
61.377 mln.
+2.441 mln.
4.14%
1 janv. 1997
64.856 mln.
+3.479 mln.
5.67%
1 janv. 1998
69.175 mln.
+4.319 mln.
6.66%
1 janv. 1999
72.265 mln.
+3.09 mln.
4.47%
1 janv. 2000
75.928 mln.
+3.663 mln.
5.07%
1 janv. 2001
78.73 mln.
+2.802 mln.
3.69%
1 janv. 2002
81.51 mln.
+2.78 mln.
3.53%
1 janv. 2003
84.558 mln.
+3.048 mln.
3.74%
1 janv. 2004
85.991 mln.
+1.433 mln.
1.69%
1 janv. 2005
93.024 mln.
+7.033 mln.
8.18%
1 janv. 2006
94.297 mln.
+1.273 mln.
1.37%
1 janv. 2007
98.829 mln.
+4.532 mln.
4.81%
1 janv. 2008
101.623 mln.
+2.794 mln.
2.83%
1 janv. 2009
102.31 mln.
+687.019 milles
0.68%
1 janv. 2010
101.854 mln.
-456.06 milles
-0.45%
1 janv. 2011
101.692 mln.
-162.361 milles
-0.16%
1 janv. 2012
100.536 mln.
-1.156 mln.
-1.14%
1 janv. 2013
96.741 mln.
-3.795 mln.
-3.77%
1 janv. 2014
94.35 mln.
-2.391 mln.
-2.47%
1 janv. 2015
89.635 mln.
-4.715 mln.
-5.0%
1 janv. 2016
84.556 mln.
-5.079 mln.
-5.67%
Classement des pays selon les statistiques actuelles par années


Commentaires: