29
/fr/
fr
AIzaSyAYiBZKx7MnpbEhh9jyipgxe19OcubqV5w
April 1, 2024
45065
Low & middle income
LMY
false
2
1
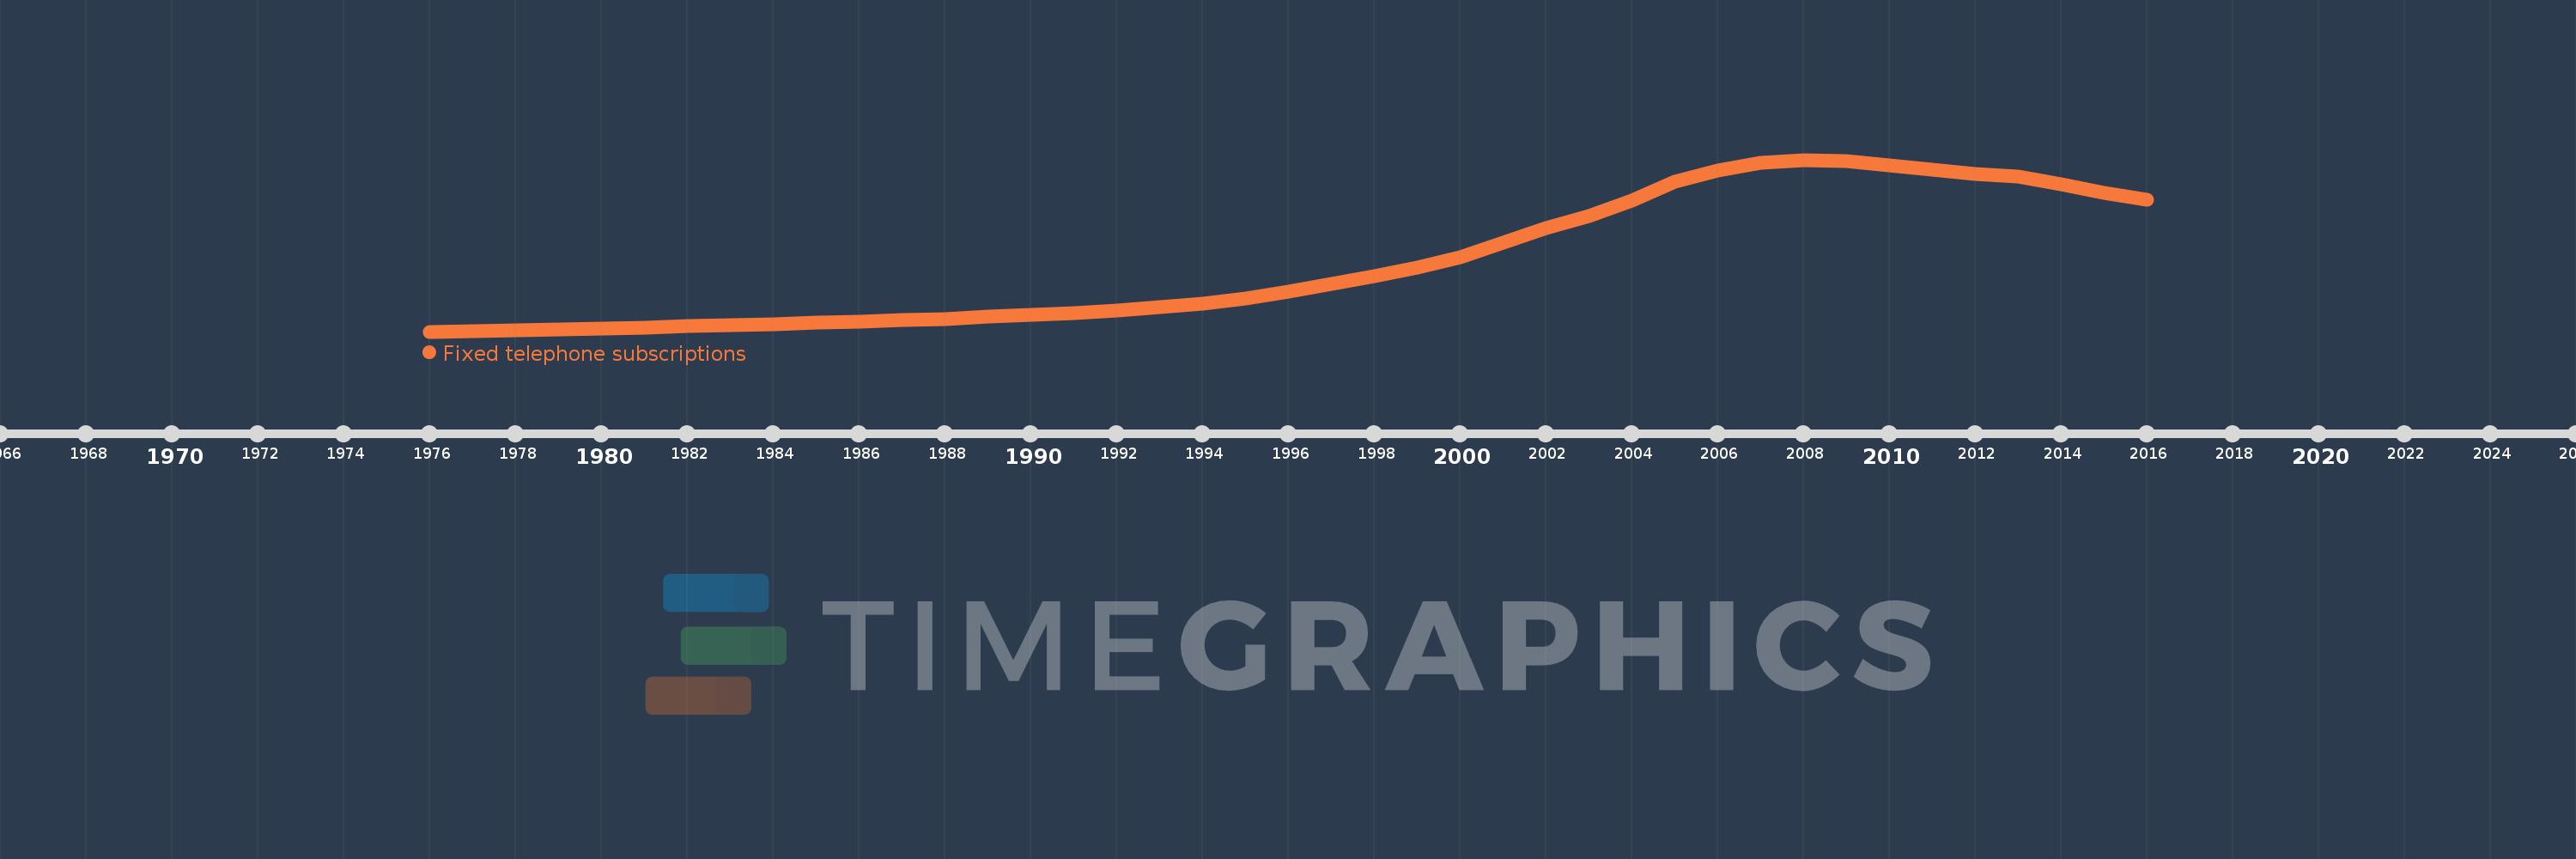
Fixed telephone subscriptions
2016,2015,2014,2013,2012,2011,2010,2009,2008,2007,2006,2005,2004,2003,2002,2001,2000,1999,1998,1997,1996,1995,1994,1993,1992,1991,1990,1989,1988,1987,1986,1985,1984,1983,1982,1981,1980,1979,1978,1977,1976
Cette statistique dans les autres pays:
AfghanistanAlbaniaAlgeriaAmerican SamoaAndorraAngolaAntigua and BarbudaArab WorldArgentinaArmeniaArubaAustraliaAustriaAzerbaijanBahamas, TheBahrainBangladeshBarbadosBelarusBelgiumBelizeBeninBermudaBhutanBoliviaBosnia and HerzegovinaBotswanaBrazilBritish Virgin IslandsBrunei DarussalamBulgariaBurkina FasoBurundiCabo VerdeCambodiaCameroonCanadaCaribbean small statesCayman IslandsCentral African RepublicCentral Europe and the BalticsChadChileChinaColombiaComorosCongo, Dem. Rep.Congo, Rep.Costa RicaCote d'IvoireCroatiaCubaCuracaoCyprusCzech RepublicDenmarkDjiboutiDominicaDominican RepublicEarly-demographic dividendEast Asia & PacificEast Asia & Pacific (excluding high income)East Asia & Pacific (IDA & IBRD countries)EcuadorEgypt, Arab Rep.El SalvadorEquatorial GuineaEritreaEstoniaEthiopiaEuro areaEurope & Central AsiaEurope & Central Asia (excluding high income)Europe & Central Asia (IDA & IBRD countries)European UnionFaroe IslandsFijiFinlandFragile and conflict affected situationsFranceFrench PolynesiaGabonGambia, TheGeorgiaGermanyGhanaGibraltarGreeceGreenlandGrenadaGuamGuatemalaGuineaGuinea-BissauGuyanaHaitiHeavily indebted poor countries (HIPC)High incomeHondurasHong Kong SAR, ChinaHungaryIBRD onlyIcelandIDA & IBRD totalIDA blendIDA onlyIDA totalIndiaIndonesiaIran, Islamic Rep.IraqIrelandIsraelItalyJamaicaJapanJordanKazakhstanKenyaKiribatiKorea, Dem. People’s Rep.Korea, Rep.KosovoKuwaitKyrgyz RepublicLao PDRLate-demographic dividendLatin America & Caribbean Latin America & Caribbean (excluding high income)Latin America & the Caribbean (IDA & IBRD countries)LatviaLeast developed countries: UN classificationLebanonLesothoLiberiaLibyaLiechtensteinLithuaniaLow & middle incomeLow incomeLower middle incomeLuxembourgMacao SAR, ChinaMacedonia, FYRMadagascarMalawiMalaysiaMaldivesMaliMaltaMarshall IslandsMauritaniaMauritiusMexicoMicronesia, Fed. Sts.Middle East & North AfricaMiddle East & North Africa (excluding high income)Middle East & North Africa (IDA & IBRD countries)Middle incomeMoldovaMonacoMongoliaMontenegroMoroccoMozambiqueMyanmarNamibiaNauruNepalNetherlandsNew CaledoniaNew ZealandNicaraguaNigerNigeriaNorth AmericaNorthern Mariana IslandsNorwayOECD membersOmanOther small statesPacific island small statesPakistanPalauPanamaPapua New GuineaParaguayPeruPhilippinesPolandPortugalPost-demographic dividendPre-demographic dividendPuerto RicoQatarRomaniaRussian FederationRwandaSamoaSan MarinoSao Tome and PrincipeSaudi ArabiaSenegalSerbiaSeychellesSierra LeoneSingaporeSlovak RepublicSloveniaSmall statesSolomon IslandsSomaliaSouth AfricaSouth AsiaSouth Asia (IDA & IBRD)South SudanSpainSri LankaSt. Kitts and NevisSt. LuciaSt. Vincent and the GrenadinesSub-Saharan Africa Sub-Saharan Africa (excluding high income)Sub-Saharan Africa (IDA & IBRD countries)SudanSurinameSwazilandSwedenSwitzerlandSyrian Arab RepublicTajikistanTanzaniaThailandTimor-LesteTogoTongaTrinidad and TobagoTunisiaTurkeyTurkmenistanTurks and Caicos IslandsTuvaluUgandaUkraineUnited Arab EmiratesUnited KingdomUnited StatesUpper middle incomeUruguayUzbekistanVanuatuVenezuela, RBVietnamVirgin Islands (U.S.)West Bank and GazaWorldYemen, Rep.ZambiaZimbabwe La ligne de temps
Cette échelle de temps montre un graphique de 1976 année à 2016 année Low & middle income. Les données jusqu'à 1975 année ne sont pas présentés. Quantité d'observations actuelles selon dates: 41.
Source (désignation):
Les indicateurs du développement mondiale
Source (organisation):
International Telecommunication Union, World Telecommunication/ICT Development Report and database, and World Bank estimates.
Catégories:
Infrastructure
Dernière mise à jour
23 avr. 2017
Les indicateurs de changement de valeurs selon les années
Minimum:
27.716 mln.
1 janv. 1976
Maximum:
722.689 mln.
1 janv. 2008
Pour la date d''observation
Valeur
Changement absolu
Le changement par rapport à la valeur précédente
1 janv. 1976
27.716 mln.
+27.716 mln.
0.0%
1 janv. 1977
30.517 mln.
+2.801 mln.
10.11%
1 janv. 1978
33.992 mln.
+3.475 mln.
11.39%
1 janv. 1979
37.239 mln.
+3.247 mln.
9.55%
1 janv. 1980
41.315 mln.
+4.076 mln.
10.95%
1 janv. 1981
44.372 mln.
+3.056 mln.
7.4%
1 janv. 1982
49.797 mln.
+5.425 mln.
12.23%
1 janv. 1983
54.078 mln.
+4.281 mln.
8.6%
1 janv. 1984
58.615 mln.
+4.537 mln.
8.39%
1 janv. 1985
63.212 mln.
+4.597 mln.
7.84%
1 janv. 1986
68.353 mln.
+5.141 mln.
8.13%
1 janv. 1987
73.827 mln.
+5.474 mln.
8.01%
1 janv. 1988
79.816 mln.
+5.989 mln.
8.11%
1 janv. 1989
87.053 mln.
+7.237 mln.
9.07%
1 janv. 1990
94.453 mln.
+7.4 mln.
8.5%
1 janv. 1991
102.861 mln.
+8.408 mln.
8.9%
1 janv. 1992
112.823 mln.
+9.962 mln.
9.68%
1 janv. 1993
125.17 mln.
+12.347 mln.
10.94%
1 janv. 1994
141.16 mln.
+15.99 mln.
12.77%
1 janv. 1995
163.161 mln.
+22.002 mln.
15.59%
1 janv. 1996
189.501 mln.
+26.34 mln.
16.14%
1 janv. 1997
219.394 mln.
+29.893 mln.
15.77%
1 janv. 1998
252.226 mln.
+32.831 mln.
14.96%
1 janv. 1999
286.517 mln.
+34.291 mln.
13.6%
1 janv. 2000
328.758 mln.
+42.242 mln.
14.74%
1 janv. 2001
387.336 mln.
+58.578 mln.
17.82%
1 janv. 2002
446.552 mln.
+59.216 mln.
15.29%
1 janv. 2003
496.758 mln.
+50.205 mln.
11.24%
1 janv. 2004
557.159 mln.
+60.401 mln.
12.16%
1 janv. 2005
632.715 mln.
+75.557 mln.
13.56%
1 janv. 2006
680.288 mln.
+47.572 mln.
7.52%
1 janv. 2007
708.943 mln.
+28.655 mln.
4.21%
1 janv. 2008
722.689 mln.
+13.746 mln.
1.94%
1 janv. 2009
718.885 mln.
-3.804 mln.
-0.53%
1 janv. 2010
700.853 mln.
-18.032 mln.
-2.51%
1 janv. 2011
682.329 mln.
-18.523 mln.
-2.64%
1 janv. 2012
664.791 mln.
-17.539 mln.
-2.57%
1 janv. 2013
653.388 mln.
-11.403 mln.
-1.72%
1 janv. 2014
624.946 mln.
-28.441 mln.
-4.35%
1 janv. 2015
589.199 mln.
-35.748 mln.
-5.72%
1 janv. 2016
560.027 mln.
-29.172 mln.
-4.95%
Classement des pays selon les statistiques actuelles par années


Commentaires: