29
/fr/
fr
AIzaSyAYiBZKx7MnpbEhh9jyipgxe19OcubqV5w
April 1, 2024
276618
United States
USA
true
2
1
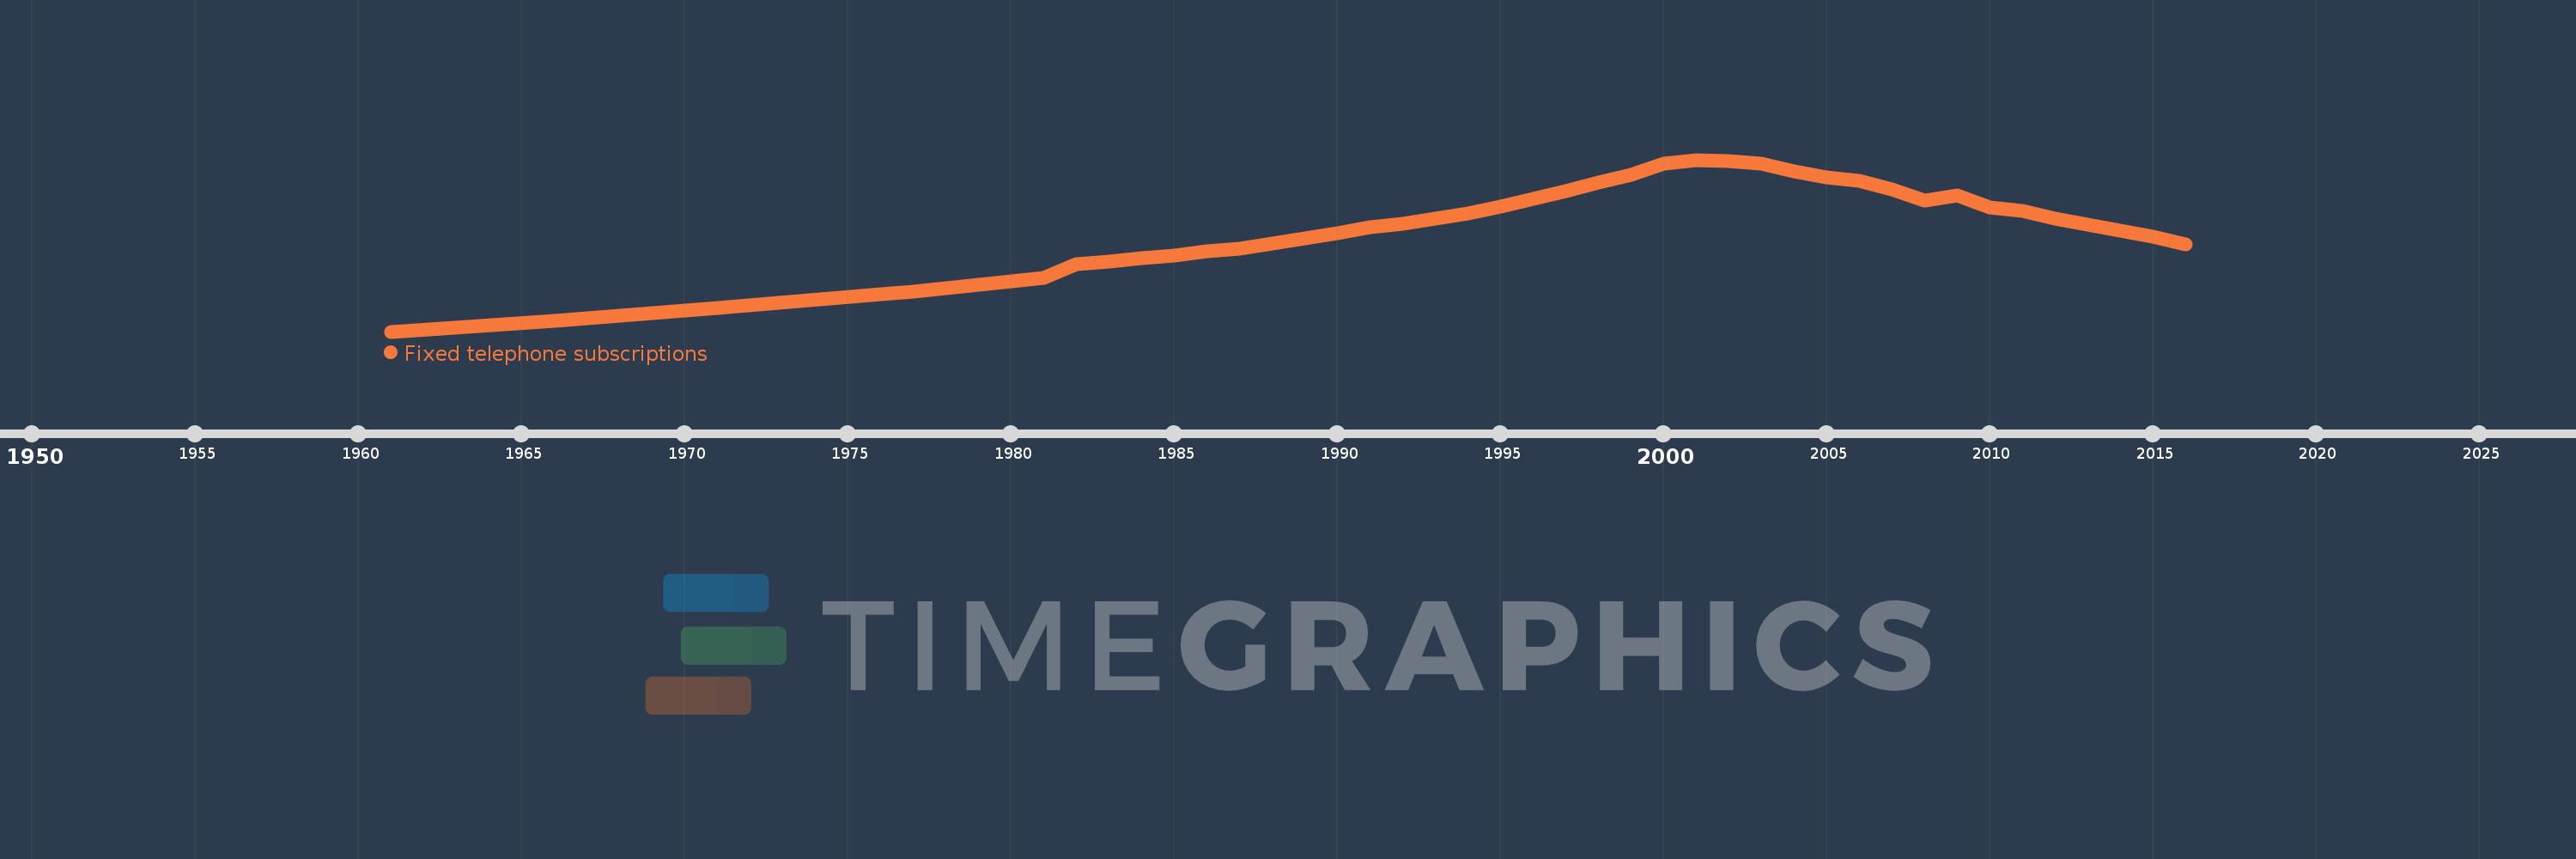
Fixed telephone subscriptions
2016,2015,2014,2013,2012,2011,2010,2009,2008,2007,2006,2005,2004,2003,2002,2001,2000,1999,1998,1997,1996,1995,1994,1993,1992,1991,1990,1989,1988,1987,1986,1985,1984,1983,1982,1981,1980,1979,1978,1977,1976,1971,1966,1961
Cette statistique dans les autres pays:
AfghanistanAlbaniaAlgeriaAmerican SamoaAndorraAngolaAntigua and BarbudaArab WorldArgentinaArmeniaArubaAustraliaAustriaAzerbaijanBahamas, TheBahrainBangladeshBarbadosBelarusBelgiumBelizeBeninBermudaBhutanBoliviaBosnia and HerzegovinaBotswanaBrazilBritish Virgin IslandsBrunei DarussalamBulgariaBurkina FasoBurundiCabo VerdeCambodiaCameroonCanadaCaribbean small statesCayman IslandsCentral African RepublicCentral Europe and the BalticsChadChileChinaColombiaComorosCongo, Dem. Rep.Congo, Rep.Costa RicaCote d'IvoireCroatiaCubaCuracaoCyprusCzech RepublicDenmarkDjiboutiDominicaDominican RepublicEarly-demographic dividendEast Asia & PacificEast Asia & Pacific (excluding high income)East Asia & Pacific (IDA & IBRD countries)EcuadorEgypt, Arab Rep.El SalvadorEquatorial GuineaEritreaEstoniaEthiopiaEuro areaEurope & Central AsiaEurope & Central Asia (excluding high income)Europe & Central Asia (IDA & IBRD countries)European UnionFaroe IslandsFijiFinlandFragile and conflict affected situationsFranceFrench PolynesiaGabonGambia, TheGeorgiaGermanyGhanaGibraltarGreeceGreenlandGrenadaGuamGuatemalaGuineaGuinea-BissauGuyanaHaitiHeavily indebted poor countries (HIPC)High incomeHondurasHong Kong SAR, ChinaHungaryIBRD onlyIcelandIDA & IBRD totalIDA blendIDA onlyIDA totalIndiaIndonesiaIran, Islamic Rep.IraqIrelandIsraelItalyJamaicaJapanJordanKazakhstanKenyaKiribatiKorea, Dem. People’s Rep.Korea, Rep.KosovoKuwaitKyrgyz RepublicLao PDRLate-demographic dividendLatin America & Caribbean Latin America & Caribbean (excluding high income)Latin America & the Caribbean (IDA & IBRD countries)LatviaLeast developed countries: UN classificationLebanonLesothoLiberiaLibyaLiechtensteinLithuaniaLow & middle incomeLow incomeLower middle incomeLuxembourgMacao SAR, ChinaMacedonia, FYRMadagascarMalawiMalaysiaMaldivesMaliMaltaMarshall IslandsMauritaniaMauritiusMexicoMicronesia, Fed. Sts.Middle East & North AfricaMiddle East & North Africa (excluding high income)Middle East & North Africa (IDA & IBRD countries)Middle incomeMoldovaMonacoMongoliaMontenegroMoroccoMozambiqueMyanmarNamibiaNauruNepalNetherlandsNew CaledoniaNew ZealandNicaraguaNigerNigeriaNorth AmericaNorthern Mariana IslandsNorwayOECD membersOmanOther small statesPacific island small statesPakistanPalauPanamaPapua New GuineaParaguayPeruPhilippinesPolandPortugalPost-demographic dividendPre-demographic dividendPuerto RicoQatarRomaniaRussian FederationRwandaSamoaSan MarinoSao Tome and PrincipeSaudi ArabiaSenegalSerbiaSeychellesSierra LeoneSingaporeSlovak RepublicSloveniaSmall statesSolomon IslandsSomaliaSouth AfricaSouth AsiaSouth Asia (IDA & IBRD)South SudanSpainSri LankaSt. Kitts and NevisSt. LuciaSt. Vincent and the GrenadinesSub-Saharan Africa Sub-Saharan Africa (excluding high income)Sub-Saharan Africa (IDA & IBRD countries)SudanSurinameSwazilandSwedenSwitzerlandSyrian Arab RepublicTajikistanTanzaniaThailandTimor-LesteTogoTongaTrinidad and TobagoTunisiaTurkeyTurkmenistanTurks and Caicos IslandsTuvaluUgandaUkraineUnited Arab EmiratesUnited KingdomUnited StatesUpper middle incomeUruguayUzbekistanVanuatuVenezuela, RBVietnamVirgin Islands (U.S.)West Bank and GazaWorldYemen, Rep.ZambiaZimbabwe La ligne de temps
Cette échelle de temps montre un graphique de 1961 année à 2016 année United States. Les données jusqu'à 1960 année ne sont pas présentés. Quantité d'observations actuelles selon dates: 44.
Source (désignation):
Les indicateurs du développement mondiale
Source (organisation):
International Telecommunication Union, World Telecommunication/ICT Development Report and database, and World Bank estimates.
Catégories:
Infrastructure
Dernière mise à jour
23 avr. 2017
Les indicateurs de changement de valeurs selon les années
Minimum:
49.269 mln.
1 janv. 1961
Maximum:
192.513 mln.
1 janv. 2001
Pour la date d''observation
Valeur
Changement absolu
Le changement par rapport à la valeur précédente
1 janv. 1961
49.269 mln.
+49.269 mln.
0.0%
1 janv. 1966
58.289 mln.
+9.02 mln.
18.31%
1 janv. 1971
69.039 mln.
+10.75 mln.
18.44%
1 janv. 1976
80.515 mln.
+11.476 mln.
16.62%
1 janv. 1977
82.802 mln.
+2.287 mln.
2.84%
1 janv. 1978
85.426 mln.
+2.624 mln.
3.17%
1 janv. 1979
88.431 mln.
+3.005 mln.
3.52%
1 janv. 1980
91.265 mln.
+2.834 mln.
3.2%
1 janv. 1981
94.282 mln.
+3.017 mln.
3.31%
1 janv. 1982
105.559 mln.
+11.277 mln.
11.96%
1 janv. 1983
107.519 mln.
+1.96 mln.
1.86%
1 janv. 1984
110.613 mln.
+3.093 mln.
2.88%
1 janv. 1985
112.551 mln.
+1.938 mln.
1.75%
1 janv. 1986
115.986 mln.
+3.435 mln.
3.05%
1 janv. 1987
118.289 mln.
+2.303 mln.
1.99%
1 janv. 1988
122.789 mln.
+4.5 mln.
3.8%
1 janv. 1989
127.087 mln.
+4.298 mln.
3.5%
1 janv. 1990
131.505 mln.
+4.418 mln.
3.48%
1 janv. 1991
136.114 mln.
+4.61 mln.
3.51%
1 janv. 1992
139.413 mln.
+3.299 mln.
2.42%
1 janv. 1993
143.342 mln.
+3.929 mln.
2.82%
1 janv. 1994
148.106 mln.
+4.765 mln.
3.32%
1 janv. 1995
153.448 mln.
+5.342 mln.
3.61%
1 janv. 1996
159.659 mln.
+6.211 mln.
4.05%
1 janv. 1997
166.446 mln.
+6.787 mln.
4.25%
1 janv. 1998
173.867 mln.
+7.421 mln.
4.46%
1 janv. 1999
179.85 mln.
+5.983 mln.
3.44%
1 janv. 2000
189.502 mln.
+9.652 mln.
5.37%
1 janv. 2001
192.513 mln.
+3.011 mln.
1.59%
1 janv. 2002
191.571 mln.
-942.2 milles
-0.49%
1 janv. 2003
189.25 mln.
-2.321 mln.
-1.21%
1 janv. 2004
182.933 mln.
-6.317 mln.
-3.34%
1 janv. 2005
177.691 mln.
-5.243 mln.
-2.87%
1 janv. 2006
175.161 mln.
-2.53 mln.
-1.42%
1 janv. 2007
167.46 mln.
-7.701 mln.
-4.4%
1 janv. 2008
158.418 mln.
-9.042 mln.
-5.4%
1 janv. 2009
162.763 mln.
+4.345 mln.
2.74%
1 janv. 2010
152.873 mln.
-9.89 mln.
-6.08%
1 janv. 2011
149.652 mln.
-3.221 mln.
-2.11%
1 janv. 2012
143.319 mln.
-6.333 mln.
-4.23%
1 janv. 2013
138.595 mln.
-4.724 mln.
-3.3%
1 janv. 2014
133.233 mln.
-5.362 mln.
-3.87%
1 janv. 2015
128.495 mln.
-4.738 mln.
-3.56%
1 janv. 2016
121.991 mln.
-6.504 mln.
-5.06%
Classement des pays selon les statistiques actuelles par années


Commentaires: