29
/
en
AIzaSyAYiBZKx7MnpbEhh9jyipgxe19OcubqV5w
April 1, 2024
282130
Vietnam
VNM
true
2
1
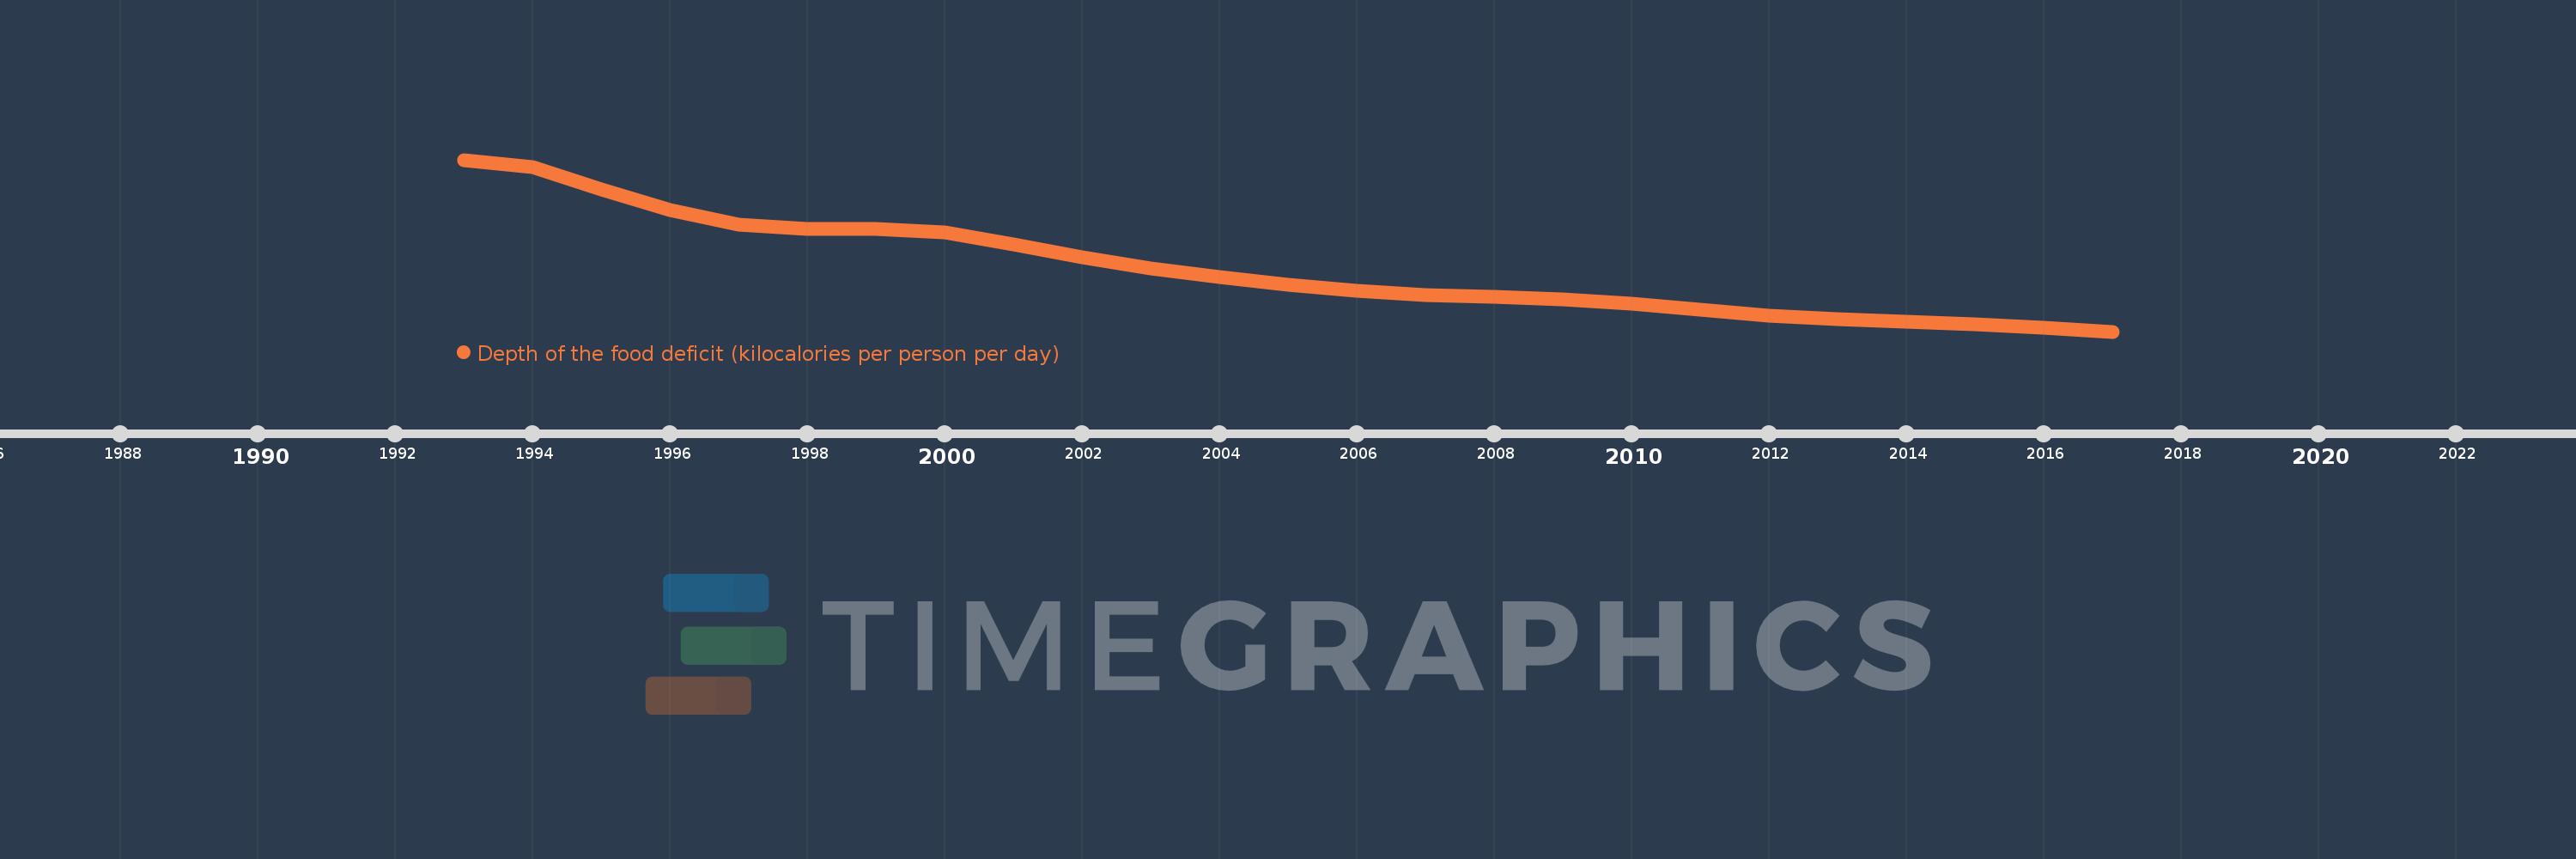
Depth of the food deficit (kilocalories per person per day)
2017,2016,2015,2014,2013,2012,2011,2010,2009,2008,2007,2006,2005,2004,2003,2002,2001,2000,1999,1998,1997,1996,1995,1994,1993
This statistics in other country:
Timeline:
This timeline shows a graph from 1993 to 2017 of Vietnam. No data until 1992. Number of actual observations by date: 25.
Source name:
World Development Indicators
Source organization:
Food and Agriculture Organization, Food Security Statistics.
Categories, topics:
Health
Last updated:
apr 23, 2017
Indicators value changes by year
At the date of observation
Value
Absolute change
Change from previous value
jan 1, 1993
368.0
+368.0
0.0%
jan 1, 1994
356.0
-12.0
-3.26%
jan 1, 1995
319.0
-37.0
-10.39%
jan 1, 1996
285.0
-34.0
-10.66%
jan 1, 1997
261.0
-24.0
-8.42%
jan 1, 1998
254.0
-7.0
-2.68%
jan 1, 1999
254.0
0.0
0.0%
jan 1, 2000
247.0
-7.0
-2.76%
jan 1, 2001
228.0
-19.0
-7.69%
jan 1, 2002
206.0
-22.0
-9.65%
jan 1, 2003
188.0
-18.0
-8.74%
jan 1, 2004
173.0
-15.0
-7.98%
jan 1, 2005
160.0
-13.0
-7.51%
jan 1, 2006
150.0
-10.0
-6.25%
jan 1, 2007
144.0
-6.0
-4.0%
jan 1, 2008
141.0
-3.0
-2.08%
jan 1, 2009
137.0
-4.0
-2.84%
jan 1, 2010
129.0
-8.0
-5.84%
jan 1, 2011
119.0
-10.0
-7.75%
jan 1, 2012
110.0
-9.0
-7.56%
jan 1, 2013
103.0
-7.0
-6.36%
jan 1, 2014
99.0
-4.0
-3.88%
jan 1, 2015
95.0
-4.0
-4.04%
jan 1, 2016
89.0
-6.0
-6.32%
jan 1, 2017
83.0
-6.0
-6.74%
Ranking of countries by current statistics by years


Comments: