29
/
en
AIzaSyAYiBZKx7MnpbEhh9jyipgxe19OcubqV5w
April 1, 2024
255055
Swaziland
SWZ
true
2
1
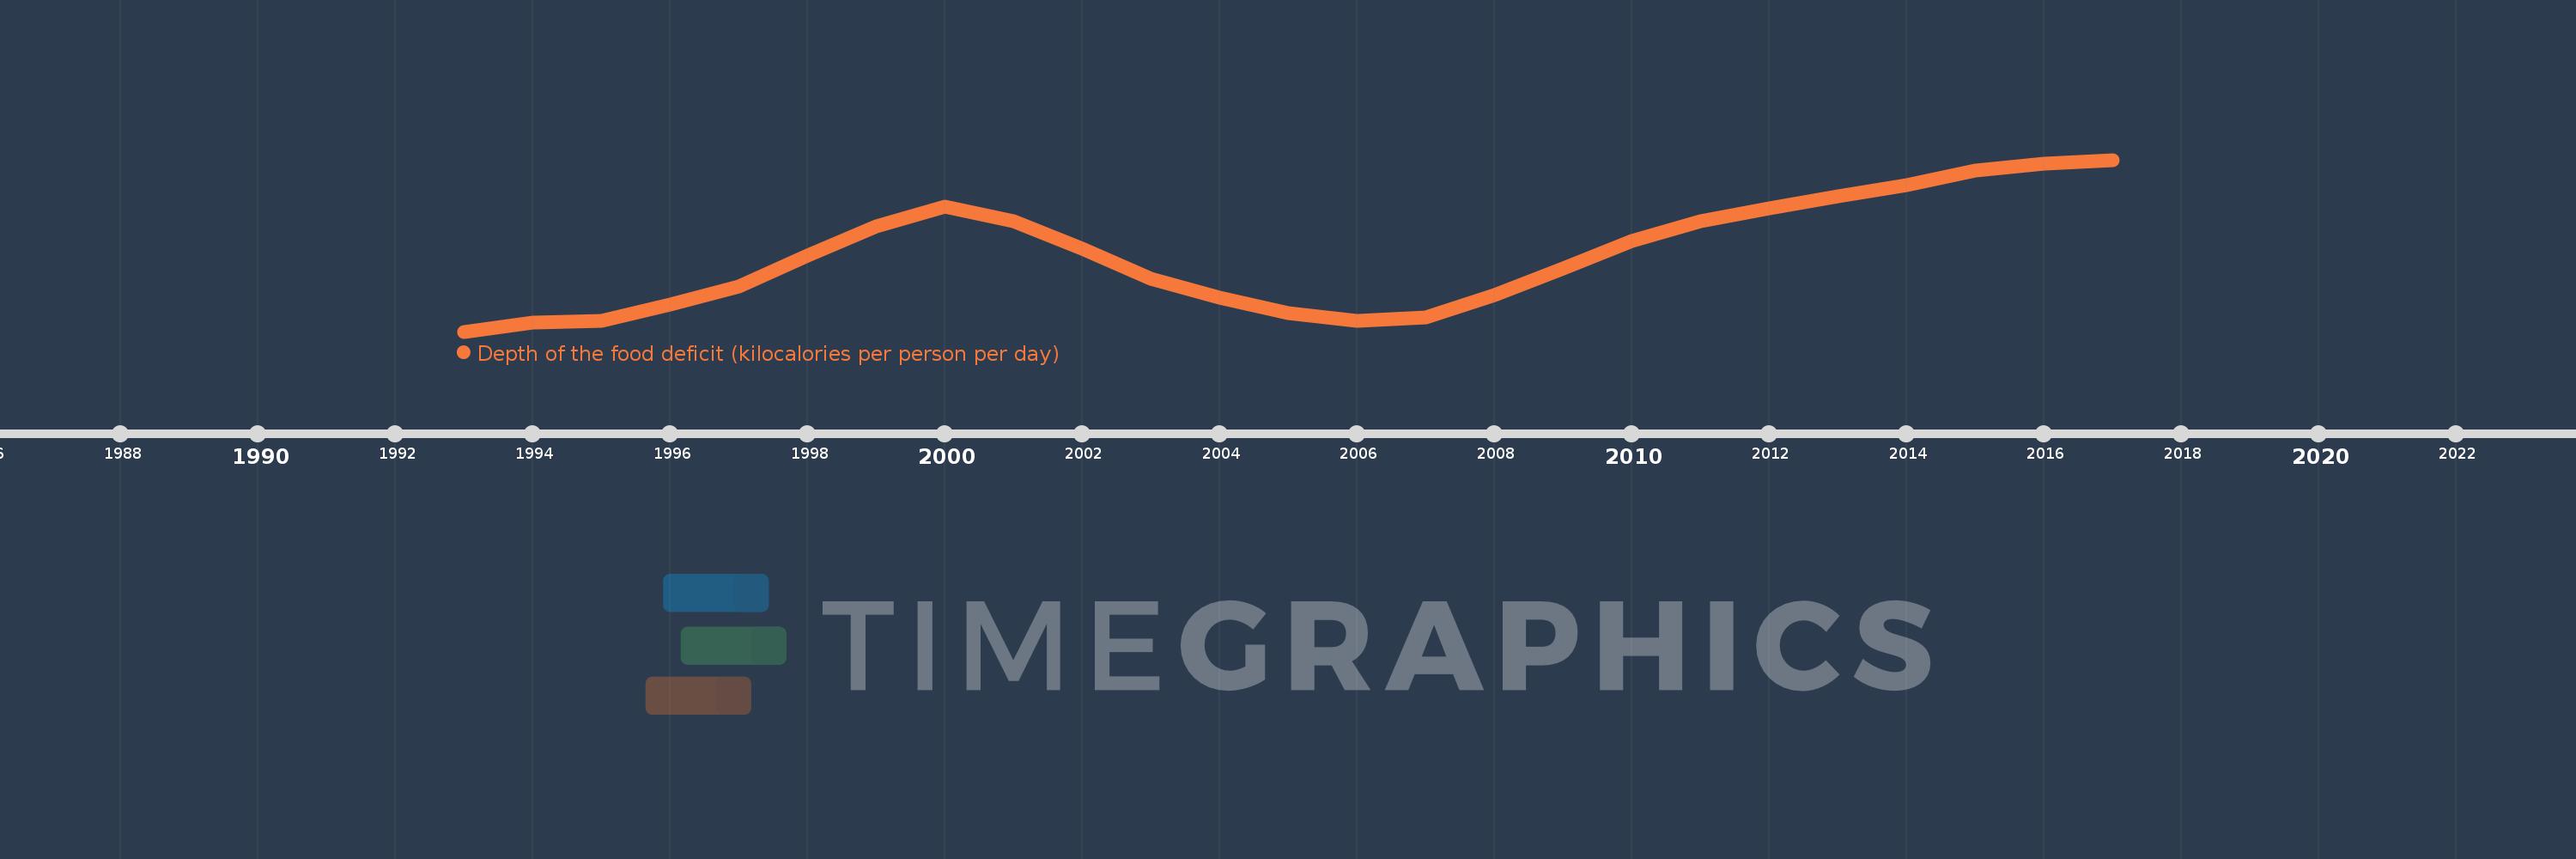
Depth of the food deficit (kilocalories per person per day)
2017,2016,2015,2014,2013,2012,2011,2010,2009,2008,2007,2006,2005,2004,2003,2002,2001,2000,1999,1998,1997,1996,1995,1994,1993
This statistics in other country:
Timeline:
This timeline shows a graph from 1993 to 2017 of Swaziland. No data until 1992. Number of actual observations by date: 25.
Source name:
World Development Indicators
Source organization:
Food and Agriculture Organization, Food Security Statistics.
Categories, topics:
Health
Last updated:
apr 23, 2017
Indicators value changes by year
At the date of observation
Value
Absolute change
Change from previous value
jan 1, 1993
97.0
+97.0
0.0%
jan 1, 1994
102.0
+5.0
5.15%
jan 1, 1995
103.0
+1.0
0.98%
jan 1, 1996
112.0
+9.0
8.74%
jan 1, 1997
122.0
+10.0
8.93%
jan 1, 1998
139.0
+17.0
13.93%
jan 1, 1999
155.0
+16.0
11.51%
jan 1, 2000
166.0
+11.0
7.1%
jan 1, 2001
158.0
-8.0
-4.82%
jan 1, 2002
143.0
-15.0
-9.49%
jan 1, 2003
126.0
-17.0
-11.89%
jan 1, 2004
116.0
-10.0
-7.94%
jan 1, 2005
107.0
-9.0
-7.76%
jan 1, 2006
103.0
-4.0
-3.74%
jan 1, 2007
105.0
+2.0
1.94%
jan 1, 2008
117.0
+12.0
11.43%
jan 1, 2009
132.0
+15.0
12.82%
jan 1, 2010
147.0
+15.0
11.36%
jan 1, 2011
158.0
+11.0
7.48%
jan 1, 2012
165.0
+7.0
4.43%
jan 1, 2013
172.0
+7.0
4.24%
jan 1, 2014
178.0
+6.0
3.49%
jan 1, 2015
186.0
+8.0
4.49%
jan 1, 2016
190.0
+4.0
2.15%
jan 1, 2017
192.0
+2.0
1.05%
Ranking of countries by current statistics by years


Comments: