29
/
en
AIzaSyAYiBZKx7MnpbEhh9jyipgxe19OcubqV5w
April 1, 2024
280807
Venezuela, RB
VEN
true
2
1
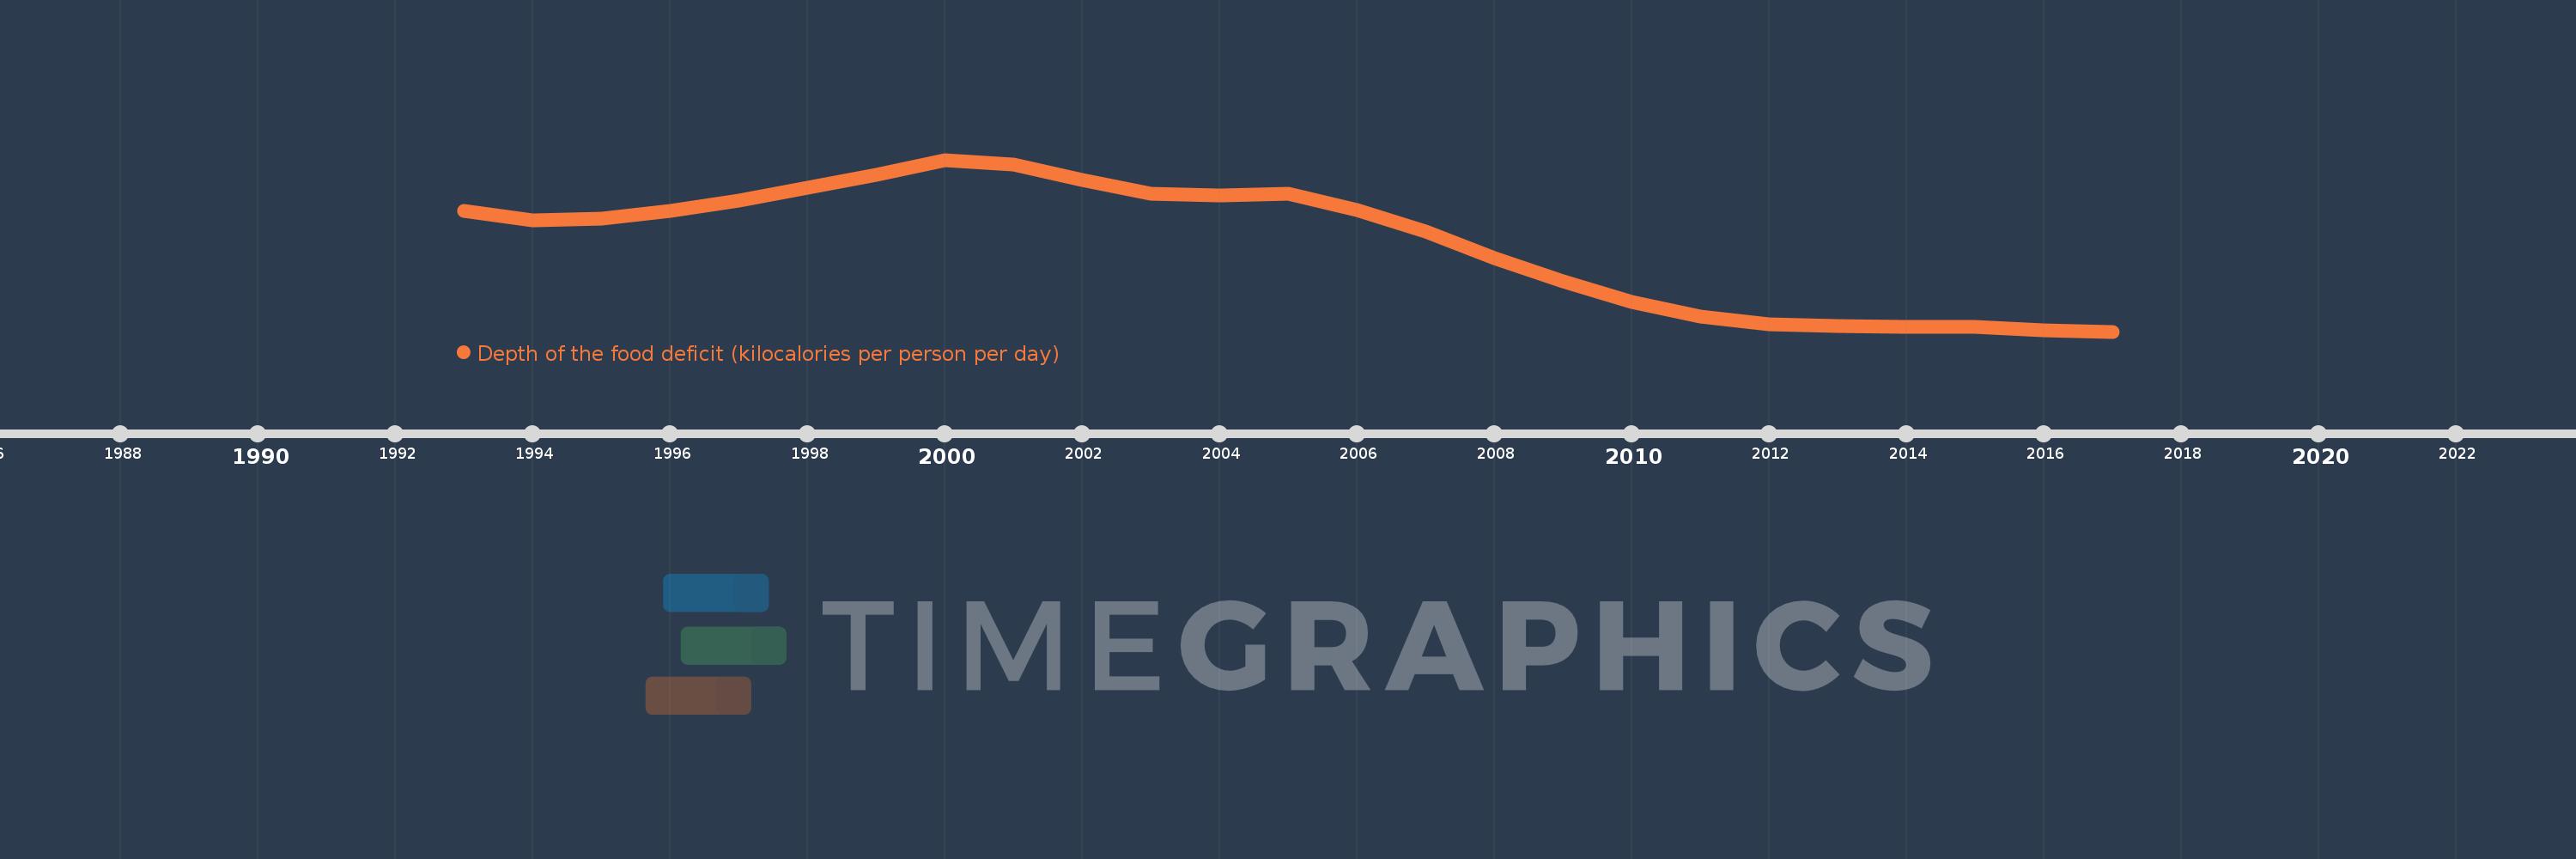
Depth of the food deficit (kilocalories per person per day)
2017,2016,2015,2014,2013,2012,2011,2010,2009,2008,2007,2006,2005,2004,2003,2002,2001,2000,1999,1998,1997,1996,1995,1994,1993
This statistics in other country:
Timeline:
This timeline shows a graph from 1993 to 2017 of Venezuela, RB. No data until 1992. Number of actual observations by date: 25.
Source name:
World Development Indicators
Source organization:
Food and Agriculture Organization, Food Security Statistics.
Categories, topics:
Health
Last updated:
apr 23, 2017
Indicators value changes by year
At the date of observation
Value
Absolute change
Change from previous value
jan 1, 1993
91.0
+91.0
0.0%
jan 1, 1994
85.0
-6.0
-6.59%
jan 1, 1995
86.0
+1.0
1.18%
jan 1, 1996
91.0
+5.0
5.81%
jan 1, 1997
98.0
+7.0
7.69%
jan 1, 1998
107.0
+9.0
9.18%
jan 1, 1999
116.0
+9.0
8.41%
jan 1, 2000
126.0
+10.0
8.62%
jan 1, 2001
123.0
-3.0
-2.38%
jan 1, 2002
112.0
-11.0
-8.94%
jan 1, 2003
103.0
-9.0
-8.04%
jan 1, 2004
102.0
-1.0
-0.97%
jan 1, 2005
103.0
+1.0
0.98%
jan 1, 2006
92.0
-11.0
-10.68%
jan 1, 2007
77.0
-15.0
-16.3%
jan 1, 2008
59.0
-18.0
-23.38%
jan 1, 2009
43.0
-16.0
-27.12%
jan 1, 2010
29.0
-14.0
-32.56%
jan 1, 2011
19.0
-10.0
-34.48%
jan 1, 2012
14.0
-5.0
-26.32%
jan 1, 2013
13.0
-1.0
-7.14%
jan 1, 2014
12.0
-1.0
-7.69%
jan 1, 2016
10.0
-2.0
-16.67%
jan 1, 2017
9.0
-1.0
-10.0%
Ranking of countries by current statistics by years


Comments: