29
/
en
AIzaSyAYiBZKx7MnpbEhh9jyipgxe19OcubqV5w
April 1, 2024
28015
East Asia & Pacific (excluding high income)
EAP
false
2
1
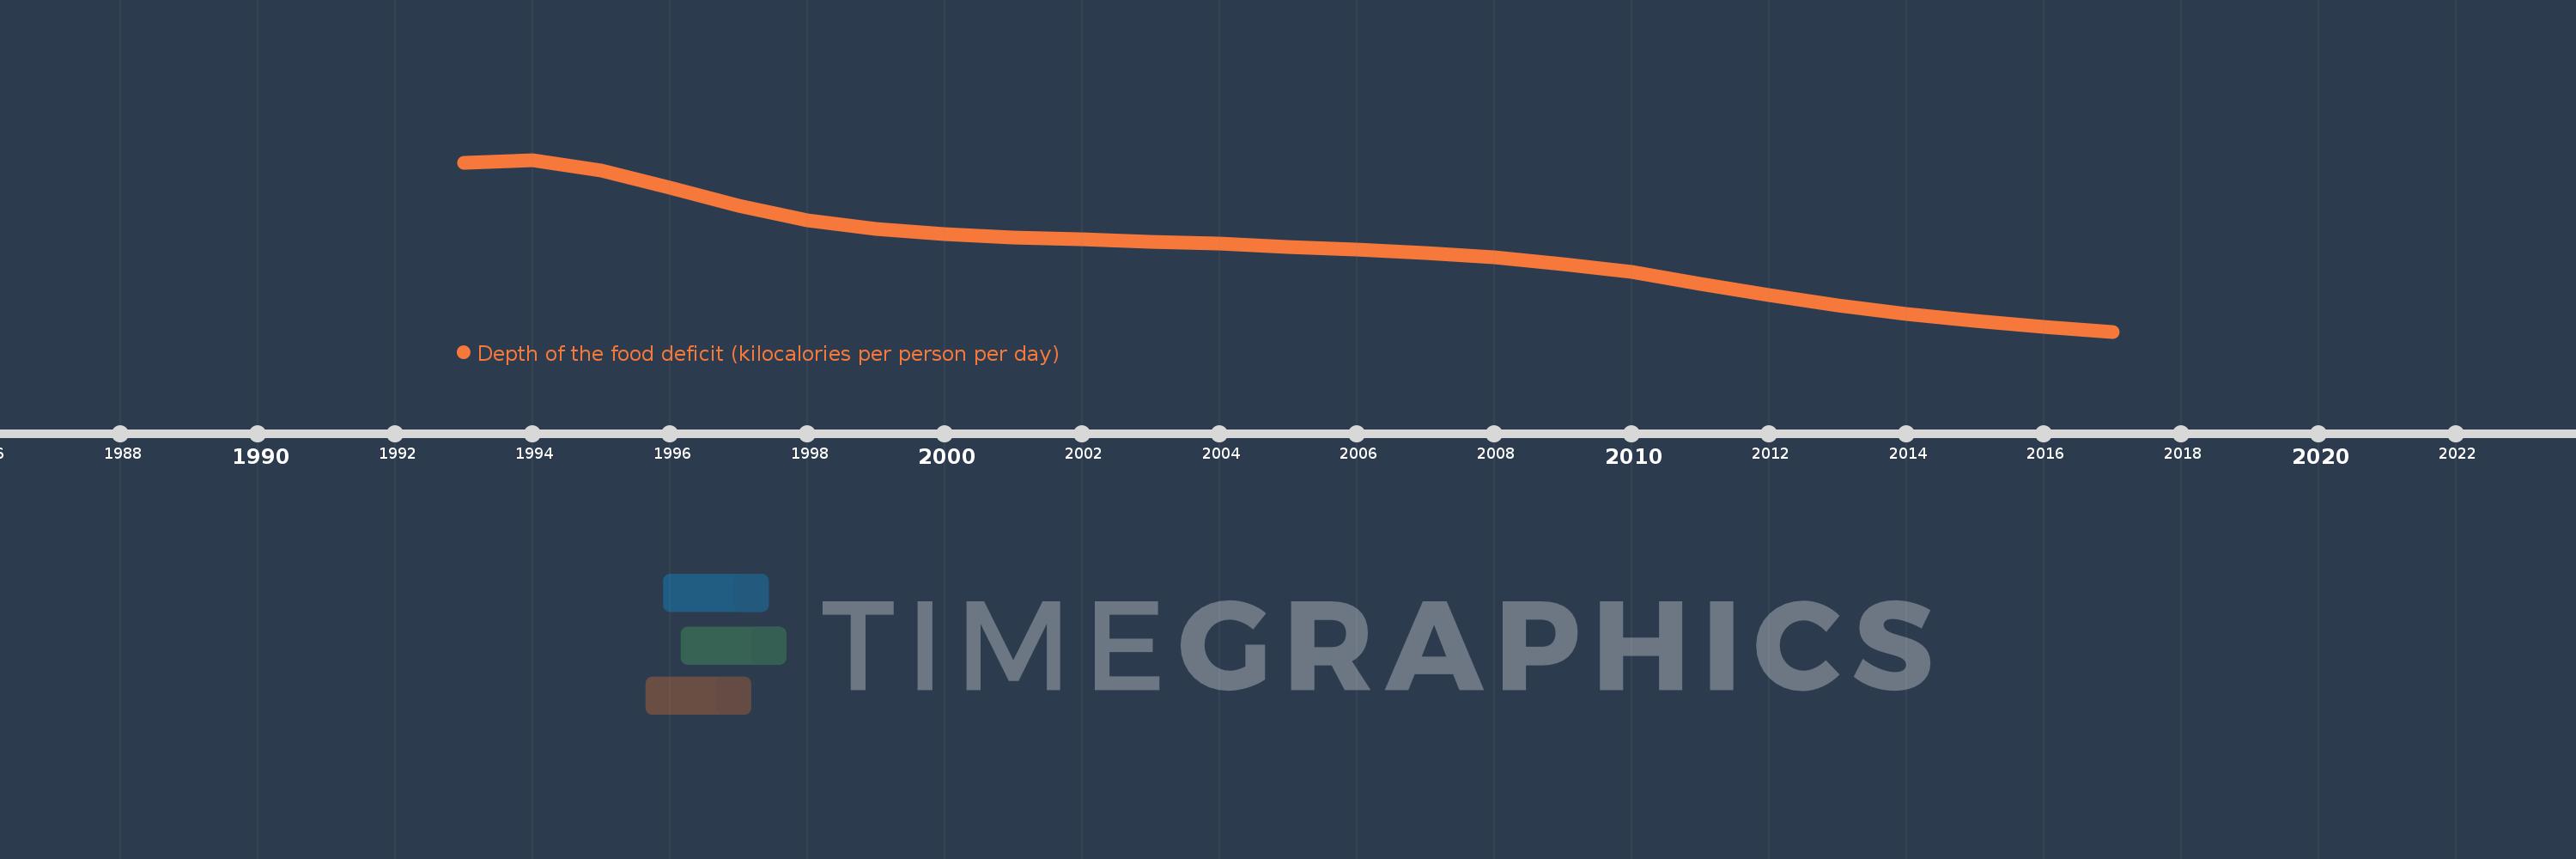
Depth of the food deficit (kilocalories per person per day)
2017,2016,2015,2014,2013,2012,2011,2010,2009,2008,2007,2006,2005,2004,2003,2002,2001,2000,1999,1998,1997,1996,1995,1994,1993
This statistics in other country:
Timeline:
This timeline shows a graph from 1993 to 2017 of East Asia & Pacific (excluding high income). No data until 1992. Number of actual observations by date: 25.
Source name:
World Development Indicators
Source organization:
Food and Agriculture Organization, Food Security Statistics.
Categories, topics:
Health
Last updated:
apr 23, 2017
Indicators value changes by year
Minimum:
75.441
jan 1, 2017
Maximum:
201.922
jan 1, 1994
At the date of observation
Value
Absolute change
Change from previous value
jan 1, 1993
199.533
+199.533
0.0%
jan 1, 1994
201.922
+2.389
1.2%
jan 1, 1995
193.965
-7.957
-3.94%
jan 1, 1996
181.624
-12.341
-6.36%
jan 1, 1997
167.825
-13.798
-7.6%
jan 1, 1998
157.084
-10.742
-6.4%
jan 1, 1999
150.821
-6.262
-3.99%
jan 1, 2000
147.091
-3.731
-2.47%
jan 1, 2001
144.967
-2.124
-1.44%
jan 1, 2002
143.588
-1.379
-0.95%
jan 1, 2003
141.49
-2.097
-1.46%
jan 1, 2004
140.004
-1.486
-1.05%
jan 1, 2005
137.879
-2.125
-1.52%
jan 1, 2006
135.9
-1.98
-1.44%
jan 1, 2007
133.414
-2.486
-1.83%
jan 1, 2008
130.346
-3.068
-2.3%
jan 1, 2009
125.157
-5.189
-3.98%
jan 1, 2010
119.407
-5.75
-4.59%
jan 1, 2011
110.521
-8.886
-7.44%
jan 1, 2012
102.378
-8.143
-7.37%
jan 1, 2013
94.635
-7.743
-7.56%
jan 1, 2014
88.449
-6.186
-6.54%
jan 1, 2015
83.54
-4.908
-5.55%
jan 1, 2016
78.964
-4.577
-5.48%
jan 1, 2017
75.441
-3.522
-4.46%
Ranking of countries by current statistics by years


Comments: