29
/
en
AIzaSyAYiBZKx7MnpbEhh9jyipgxe19OcubqV5w
April 1, 2024
266693
Trinidad and Tobago
TTO
true
2
1
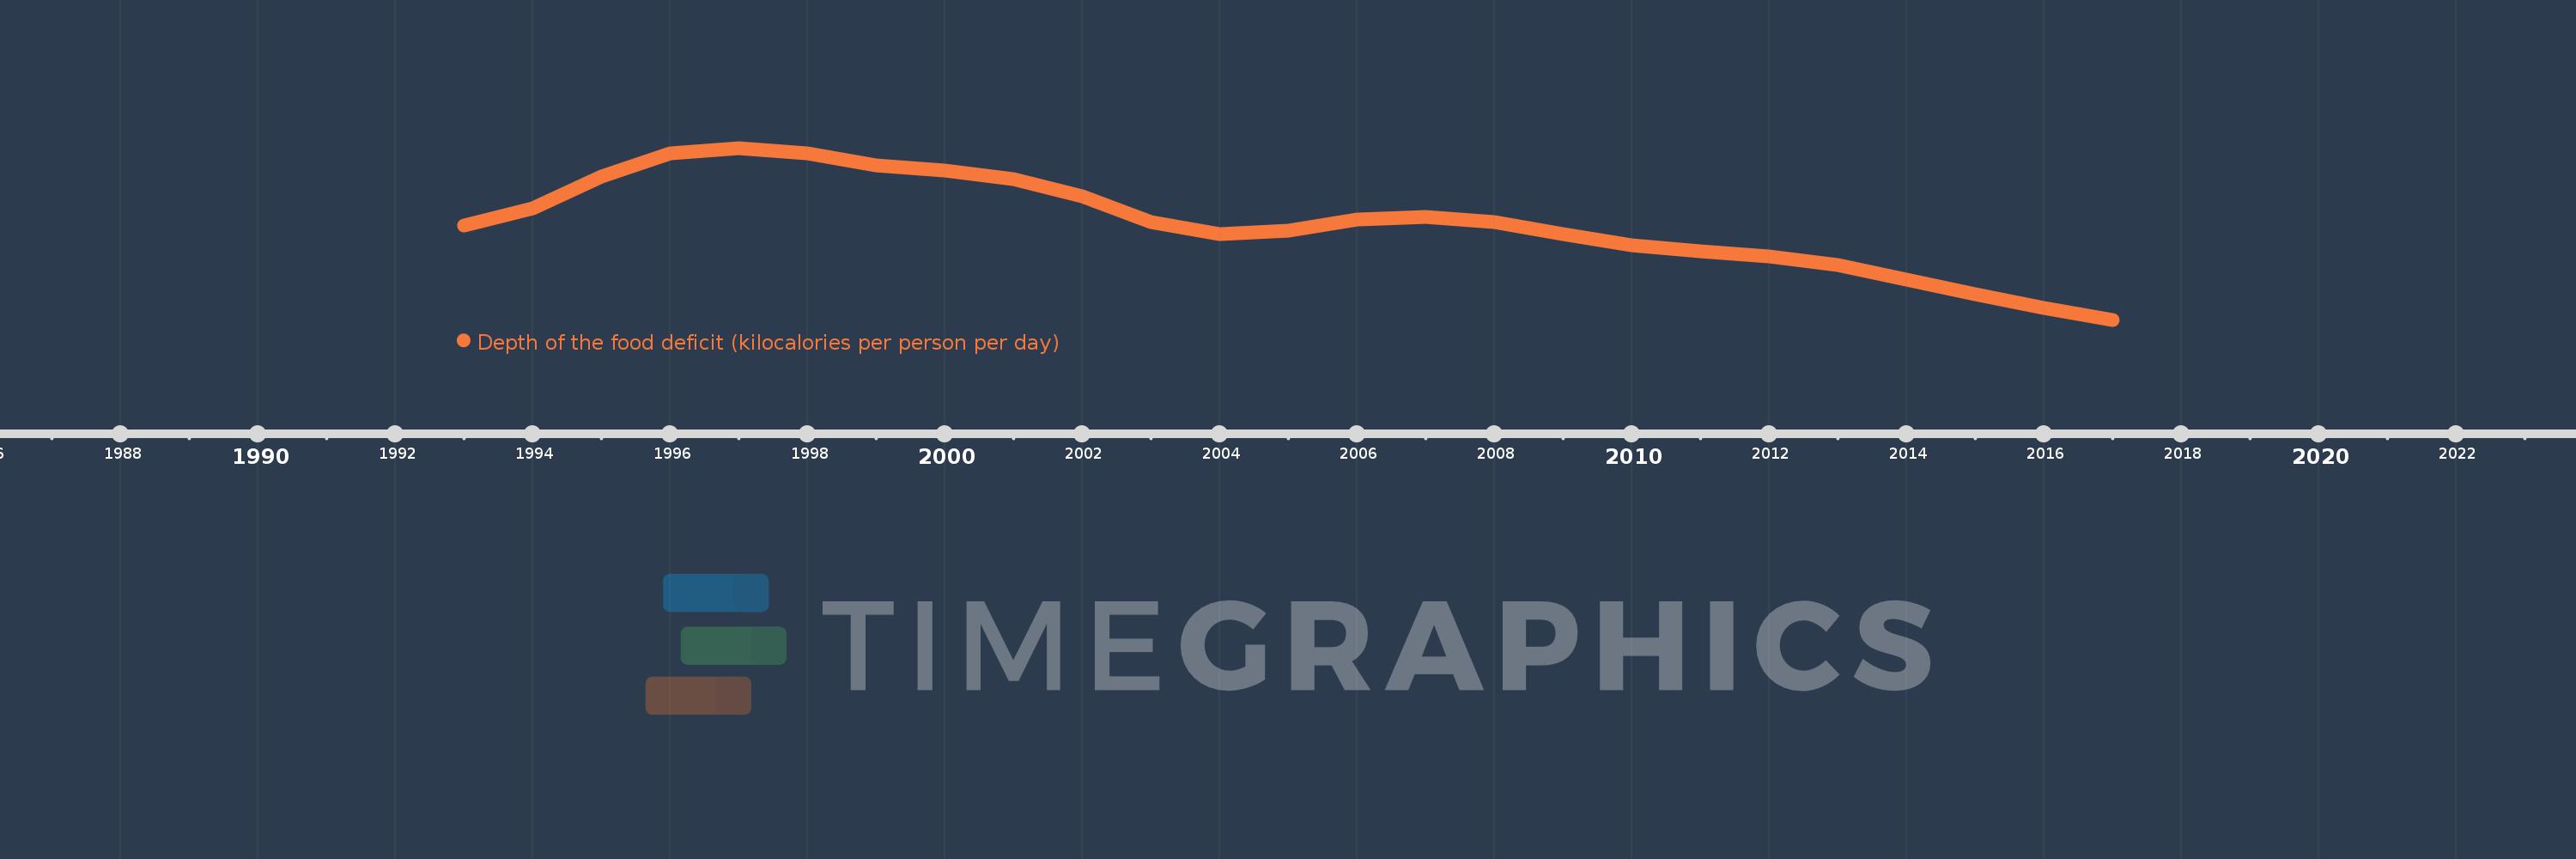
Depth of the food deficit (kilocalories per person per day)
2017,2016,2015,2014,2013,2012,2011,2010,2009,2008,2007,2006,2005,2004,2003,2002,2001,2000,1999,1998,1997,1996,1995,1994,1993
This statistics in other country:
Timeline:
This timeline shows a graph from 1993 to 2017 of Trinidad and Tobago. No data until 1992. Number of actual observations by date: 25.
Source name:
World Development Indicators
Source organization:
Food and Agriculture Organization, Food Security Statistics.
Categories, topics:
Health
Last updated:
apr 23, 2017
Indicators value changes by year
At the date of observation
Value
Absolute change
Change from previous value
jan 1, 1993
88.0
+88.0
0.0%
jan 1, 1994
94.0
+6.0
6.82%
jan 1, 1995
105.0
+11.0
11.7%
jan 1, 1996
113.0
+8.0
7.62%
jan 1, 1997
115.0
+2.0
1.77%
jan 1, 1998
113.0
-2.0
-1.74%
jan 1, 1999
109.0
-4.0
-3.54%
jan 1, 2000
107.0
-2.0
-1.83%
jan 1, 2001
104.0
-3.0
-2.8%
jan 1, 2002
98.0
-6.0
-5.77%
jan 1, 2003
89.0
-9.0
-9.18%
jan 1, 2004
85.0
-4.0
-4.49%
jan 1, 2005
86.0
+1.0
1.18%
jan 1, 2006
90.0
+4.0
4.65%
jan 1, 2007
91.0
+1.0
1.11%
jan 1, 2008
89.0
-2.0
-2.2%
jan 1, 2009
85.0
-4.0
-4.49%
jan 1, 2010
81.0
-4.0
-4.71%
jan 1, 2011
79.0
-2.0
-2.47%
jan 1, 2012
77.0
-2.0
-2.53%
jan 1, 2013
74.0
-3.0
-3.9%
jan 1, 2014
69.0
-5.0
-6.76%
jan 1, 2015
64.0
-5.0
-7.25%
jan 1, 2016
59.0
-5.0
-7.81%
jan 1, 2017
55.0
-4.0
-6.78%
Ranking of countries by current statistics by years


Comments: