29
/
en
AIzaSyAYiBZKx7MnpbEhh9jyipgxe19OcubqV5w
April 1, 2024
43318
Latin America & the Caribbean (IDA & IBRD countries)
TLA
false
2
1
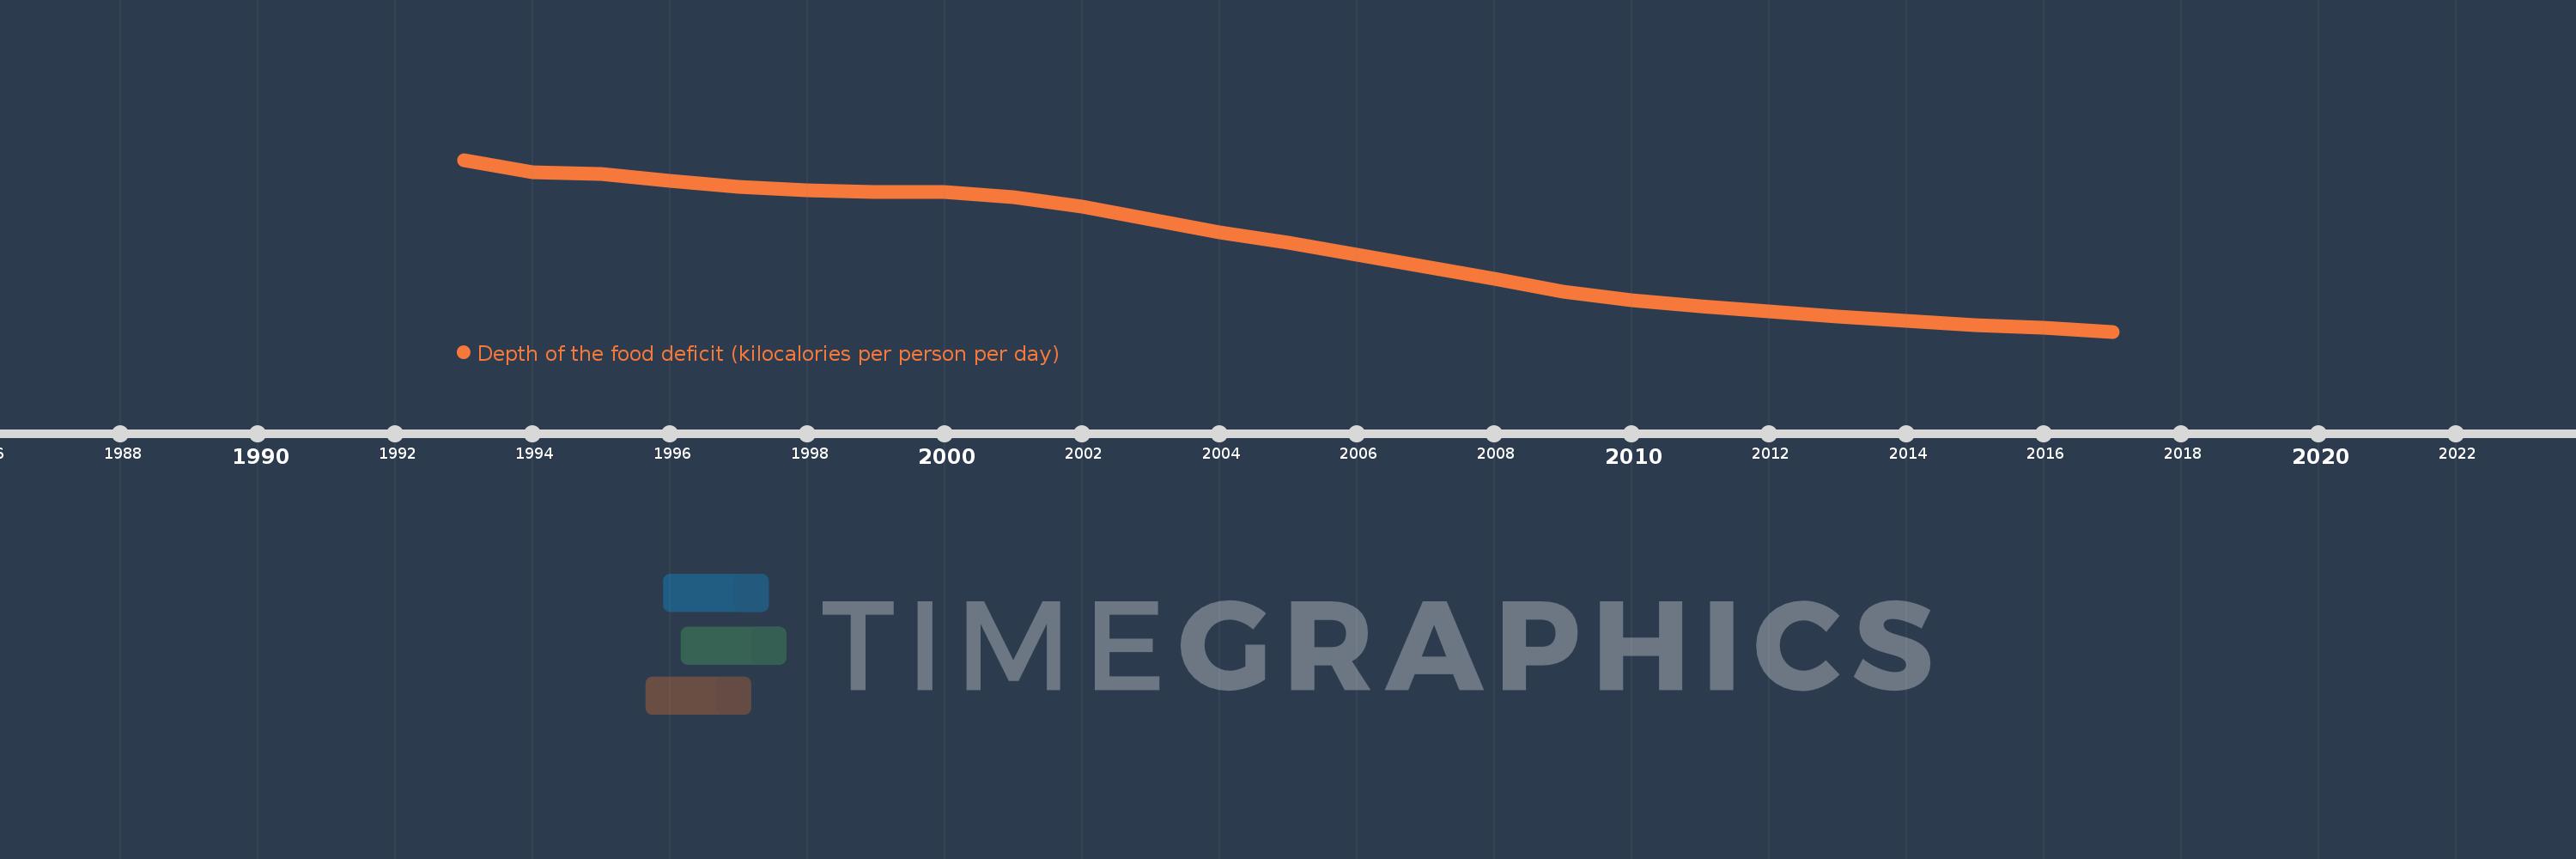
Depth of the food deficit (kilocalories per person per day)
2017,2016,2015,2014,2013,2012,2011,2010,2009,2008,2007,2006,2005,2004,2003,2002,2001,2000,1999,1998,1997,1996,1995,1994,1993
This statistics in other country:
Timeline:
This timeline shows a graph from 1993 to 2017 of Latin America & the Caribbean (IDA & IBRD countries). No data until 1992. Number of actual observations by date: 25.
Source name:
World Development Indicators
Source organization:
Food and Agriculture Organization, Food Security Statistics.
Categories, topics:
Health
Last updated:
apr 23, 2017
Indicators value changes by year
Minimum:
40.565
jan 1, 2017
Maximum:
106.931
jan 1, 1993
At the date of observation
Value
Absolute change
Change from previous value
jan 1, 1993
106.931
+106.931
0.0%
jan 1, 1994
102.283
-4.649
-4.35%
jan 1, 1995
101.59
-0.693
-0.68%
jan 1, 1996
98.672
-2.918
-2.87%
jan 1, 1997
96.462
-2.209
-2.24%
jan 1, 1998
95.278
-1.185
-1.23%
jan 1, 1999
94.51
-0.768
-0.81%
jan 1, 2000
94.475
-0.035
-0.04%
jan 1, 2001
92.655
-1.82
-1.93%
jan 1, 2002
88.845
-3.81
-4.11%
jan 1, 2003
83.761
-5.084
-5.72%
jan 1, 2004
79.019
-4.742
-5.66%
jan 1, 2005
74.797
-4.222
-5.34%
jan 1, 2006
70.162
-4.635
-6.2%
jan 1, 2007
65.749
-4.413
-6.29%
jan 1, 2008
61.003
-4.746
-7.22%
jan 1, 2009
56.131
-4.871
-7.99%
jan 1, 2010
52.655
-3.476
-6.19%
jan 1, 2011
50.208
-2.446
-4.65%
jan 1, 2012
48.357
-1.851
-3.69%
jan 1, 2013
46.378
-1.979
-4.09%
jan 1, 2014
44.613
-1.765
-3.81%
jan 1, 2015
42.952
-1.661
-3.72%
jan 1, 2016
41.912
-1.041
-2.42%
jan 1, 2017
40.565
-1.346
-3.21%
Ranking of countries by current statistics by years


Comments: