29
/
en
AIzaSyAYiBZKx7MnpbEhh9jyipgxe19OcubqV5w
April 1, 2024
230893
Rwanda
RWA
true
2
1
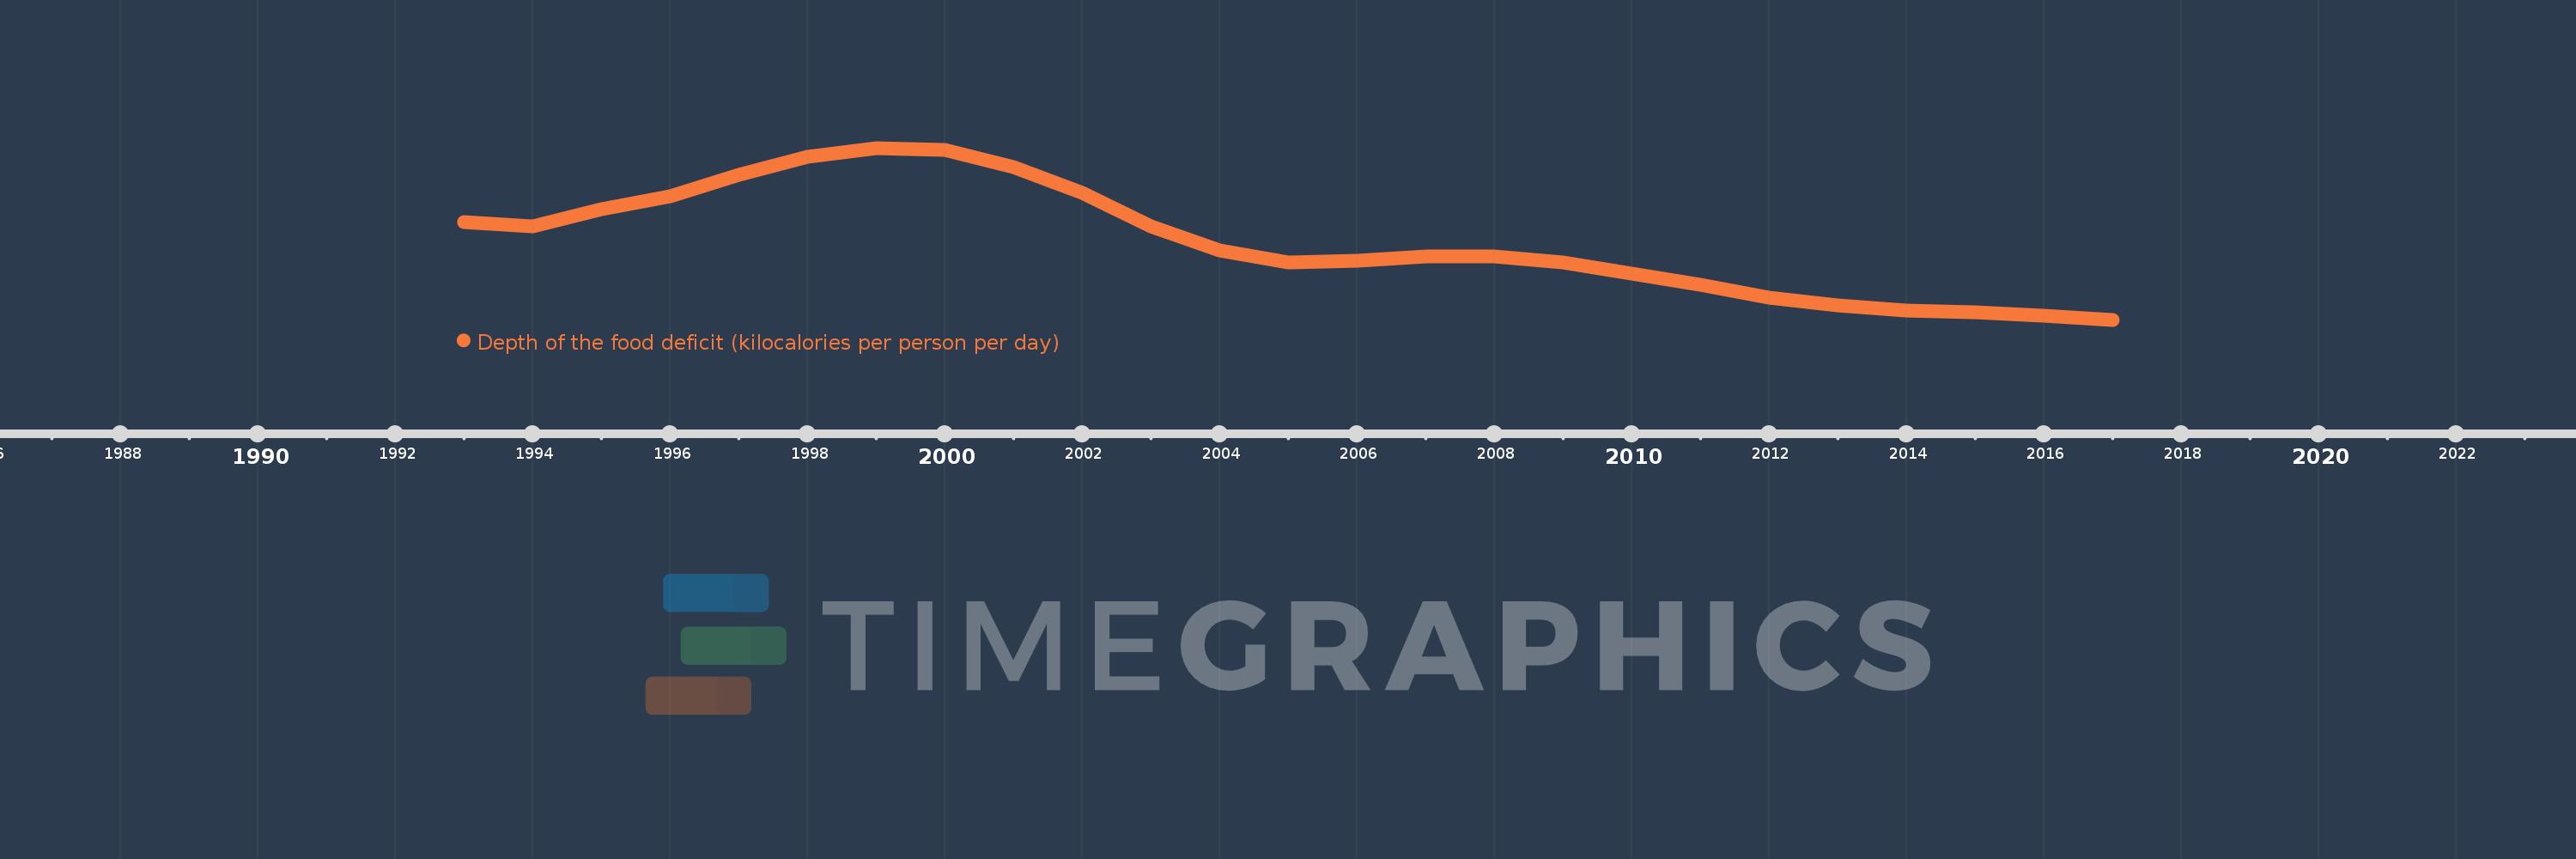
Depth of the food deficit (kilocalories per person per day)
2017,2016,2015,2014,2013,2012,2011,2010,2009,2008,2007,2006,2005,2004,2003,2002,2001,2000,1999,1998,1997,1996,1995,1994,1993
This statistics in other country:
Timeline:
This timeline shows a graph from 1993 to 2017 of Rwanda. No data until 1992. Number of actual observations by date: 25.
Source name:
World Development Indicators
Source organization:
Food and Agriculture Organization, Food Security Statistics.
Categories, topics:
Health
Last updated:
apr 23, 2017
Indicators value changes by year
At the date of observation
Value
Absolute change
Change from previous value
jan 1, 1993
426.0
+426.0
0.0%
jan 1, 1994
417.0
-9.0
-2.11%
jan 1, 1995
450.0
+33.0
7.91%
jan 1, 1996
476.0
+26.0
5.78%
jan 1, 1997
518.0
+42.0
8.82%
jan 1, 1998
555.0
+37.0
7.14%
jan 1, 1999
572.0
+17.0
3.06%
jan 1, 2000
568.0
-4.0
-0.7%
jan 1, 2001
534.0
-34.0
-5.99%
jan 1, 2002
483.0
-51.0
-9.55%
jan 1, 2003
417.0
-66.0
-13.66%
jan 1, 2004
369.0
-48.0
-11.51%
jan 1, 2005
345.0
-24.0
-6.5%
jan 1, 2006
348.0
+3.0
0.87%
jan 1, 2007
357.0
+9.0
2.59%
jan 1, 2008
357.0
0.0
0.0%
jan 1, 2009
346.0
-11.0
-3.08%
jan 1, 2010
324.0
-22.0
-6.36%
jan 1, 2011
301.0
-23.0
-7.1%
jan 1, 2012
276.0
-25.0
-8.31%
jan 1, 2013
260.0
-16.0
-5.8%
jan 1, 2014
251.0
-9.0
-3.46%
jan 1, 2015
247.0
-4.0
-1.59%
jan 1, 2016
240.0
-7.0
-2.83%
jan 1, 2017
232.0
-8.0
-3.33%
Ranking of countries by current statistics by years


Comments: