29
/
en
AIzaSyAYiBZKx7MnpbEhh9jyipgxe19OcubqV5w
April 1, 2024
239164
Sierra Leone
SLE
true
2
1
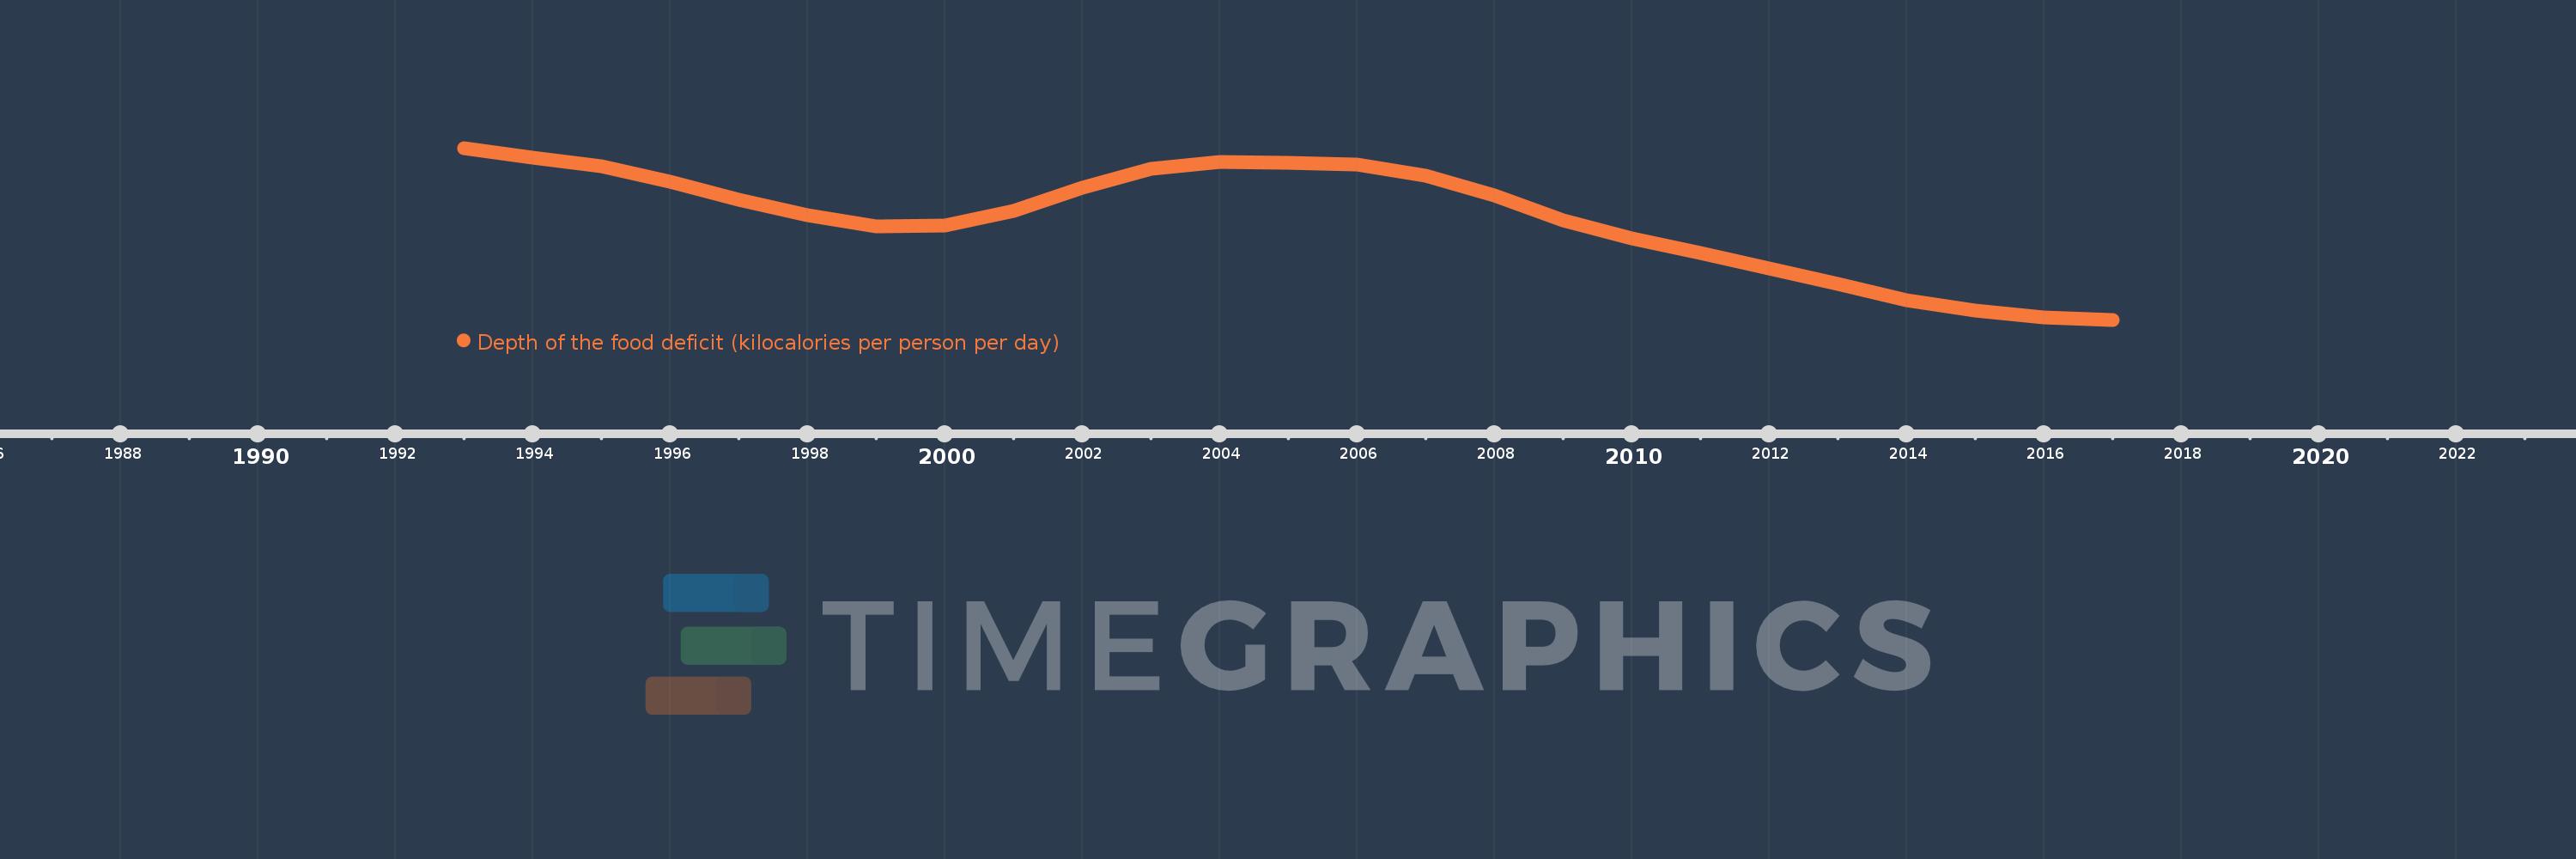
Depth of the food deficit (kilocalories per person per day)
2017,2016,2015,2014,2013,2012,2011,2010,2009,2008,2007,2006,2005,2004,2003,2002,2001,2000,1999,1998,1997,1996,1995,1994,1993
This statistics in other country:
Timeline:
This timeline shows a graph from 1993 to 2017 of Sierra Leone. No data until 1992. Number of actual observations by date: 25.
Source name:
World Development Indicators
Source organization:
Food and Agriculture Organization, Food Security Statistics.
Categories, topics:
Health
Last updated:
apr 23, 2017
Indicators value changes by year
At the date of observation
Value
Absolute change
Change from previous value
jan 1, 1993
333.0
+333.0
0.0%
jan 1, 1994
323.0
-10.0
-3.0%
jan 1, 1995
315.0
-8.0
-2.48%
jan 1, 1996
299.0
-16.0
-5.08%
jan 1, 1997
281.0
-18.0
-6.02%
jan 1, 1998
265.0
-16.0
-5.69%
jan 1, 1999
254.0
-11.0
-4.15%
jan 1, 2000
255.0
+1.0
0.39%
jan 1, 2001
270.0
+15.0
5.88%
jan 1, 2002
293.0
+23.0
8.52%
jan 1, 2003
312.0
+19.0
6.48%
jan 1, 2004
319.0
+7.0
2.24%
jan 1, 2005
318.0
-1.0
-0.31%
jan 1, 2006
316.0
-2.0
-0.63%
jan 1, 2007
305.0
-11.0
-3.48%
jan 1, 2008
285.0
-20.0
-6.56%
jan 1, 2009
260.0
-25.0
-8.77%
jan 1, 2010
242.0
-18.0
-6.92%
jan 1, 2011
227.0
-15.0
-6.2%
jan 1, 2012
212.0
-15.0
-6.61%
jan 1, 2013
196.0
-16.0
-7.55%
jan 1, 2014
180.0
-16.0
-8.16%
jan 1, 2015
169.0
-11.0
-6.11%
jan 1, 2016
162.0
-7.0
-4.14%
jan 1, 2017
160.0
-2.0
-1.23%
Ranking of countries by current statistics by years


Comments: