29
/
en
AIzaSyAYiBZKx7MnpbEhh9jyipgxe19OcubqV5w
April 1, 2024
27186
East Asia & Pacific
EAS
false
2
1
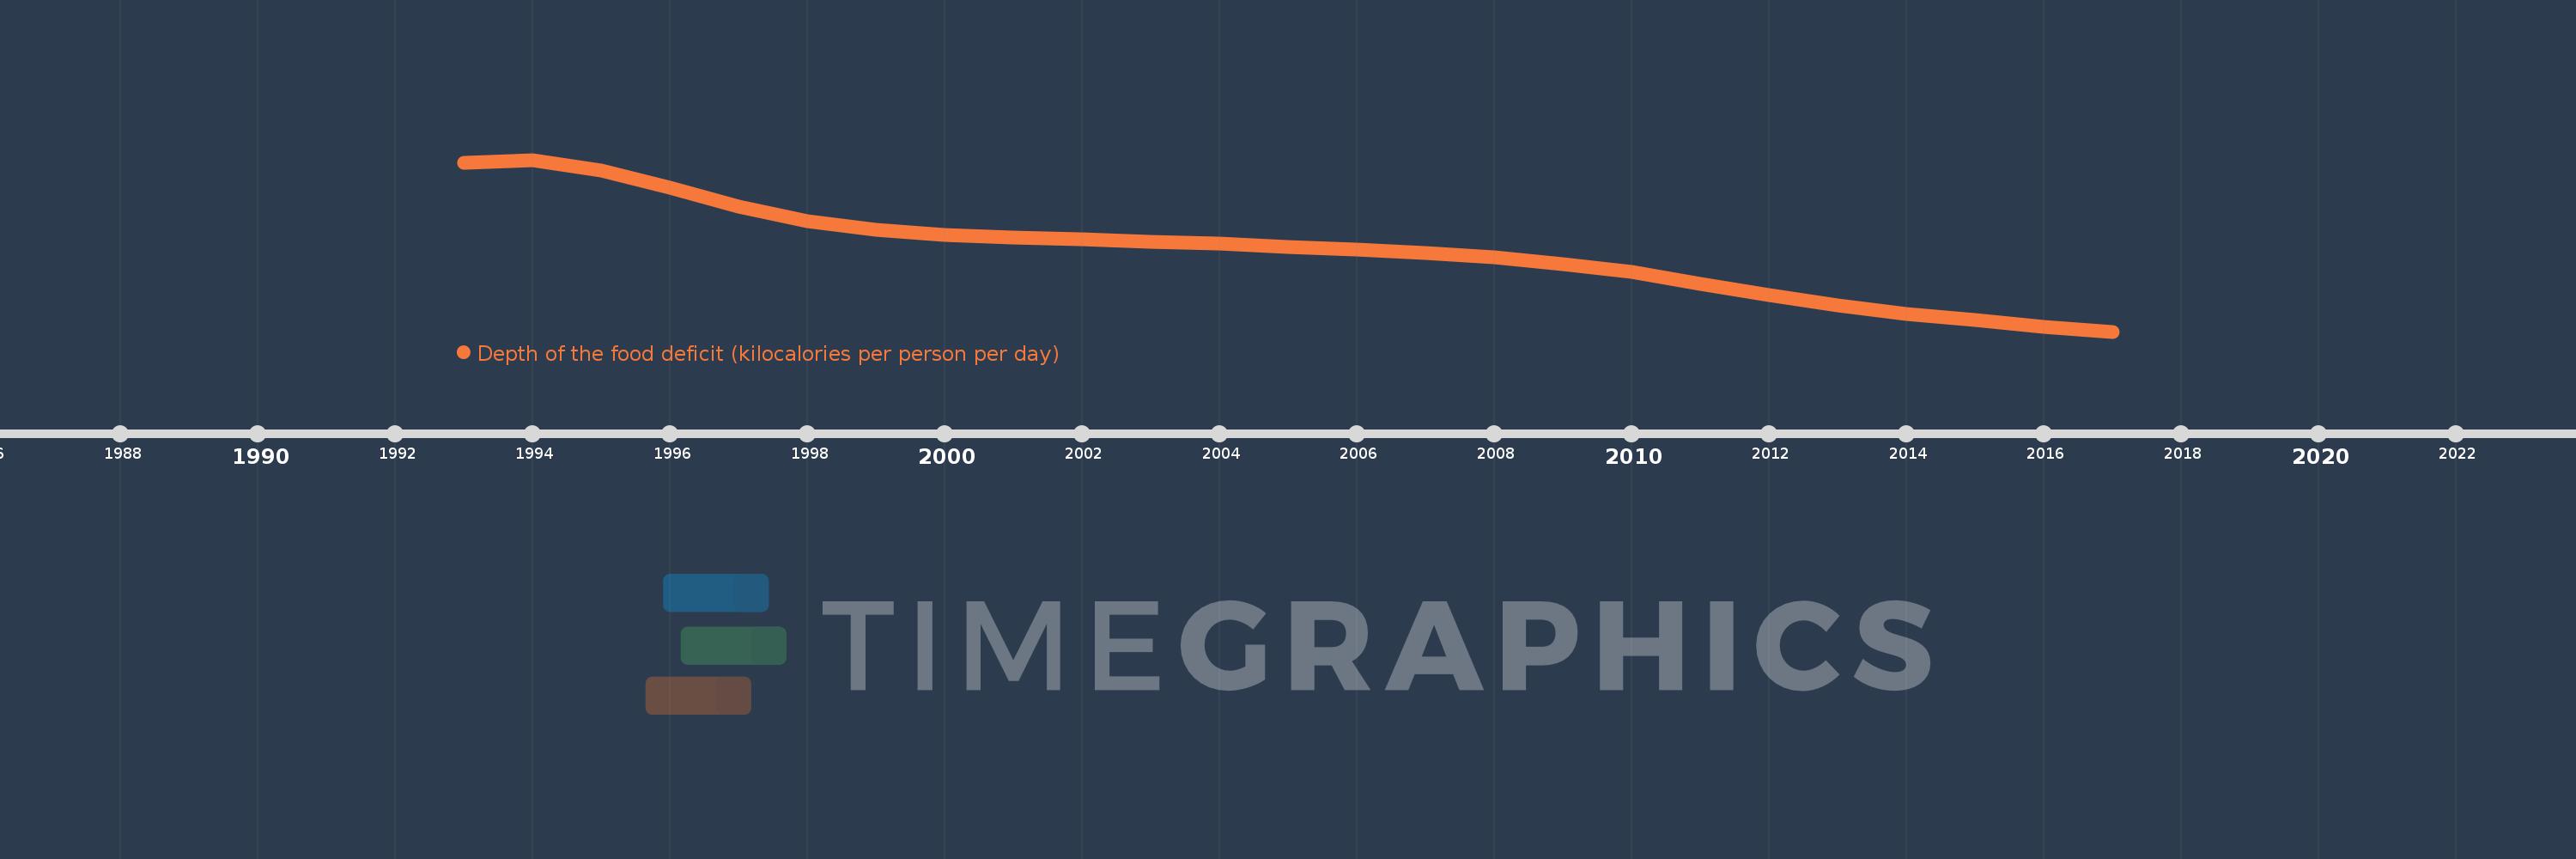
Depth of the food deficit (kilocalories per person per day)
2017,2016,2015,2014,2013,2012,2011,2010,2009,2008,2007,2006,2005,2004,2003,2002,2001,2000,1999,1998,1997,1996,1995,1994,1993
This statistics in other country:
Timeline:
This timeline shows a graph from 1993 to 2017 of East Asia & Pacific. No data until 1992. Number of actual observations by date: 25.
Source name:
World Development Indicators
Source organization:
Food and Agriculture Organization, Food Security Statistics.
Categories, topics:
Health
Last updated:
apr 23, 2017
Indicators value changes by year
Minimum:
73.693
jan 1, 2017
Maximum:
195.003
jan 1, 1994
At the date of observation
Value
Absolute change
Change from previous value
jan 1, 1993
192.72
+192.72
0.0%
jan 1, 1994
195.003
+2.284
1.18%
jan 1, 1995
187.333
-7.67
-3.93%
jan 1, 1996
175.431
-11.902
-6.35%
jan 1, 1997
162.129
-13.302
-7.58%
jan 1, 1998
151.765
-10.364
-6.39%
jan 1, 1999
145.765
-6.0
-3.95%
jan 1, 2000
142.189
-3.576
-2.45%
jan 1, 2001
140.176
-2.012
-1.42%
jan 1, 2002
138.881
-1.295
-0.92%
jan 1, 2003
136.912
-1.97
-1.42%
jan 1, 2004
135.567
-1.344
-0.98%
jan 1, 2005
133.562
-2.006
-1.48%
jan 1, 2006
131.687
-1.874
-1.4%
jan 1, 2007
129.338
-2.349
-1.78%
jan 1, 2008
126.414
-2.923
-2.26%
jan 1, 2009
121.449
-4.966
-3.93%
jan 1, 2010
115.926
-5.522
-4.55%
jan 1, 2011
107.355
-8.572
-7.39%
jan 1, 2012
99.47
-7.884
-7.34%
jan 1, 2013
91.952
-7.518
-7.56%
jan 1, 2014
85.947
-6.005
-6.53%
jan 1, 2015
81.607
-4.34
-5.05%
jan 1, 2016
77.124
-4.483
-5.49%
jan 1, 2017
73.693
-3.431
-4.45%
Ranking of countries by current statistics by years


Comments: