29
/
en
AIzaSyAYiBZKx7MnpbEhh9jyipgxe19OcubqV5w
April 1, 2024
38882
IDA only
IDX
false
2
1
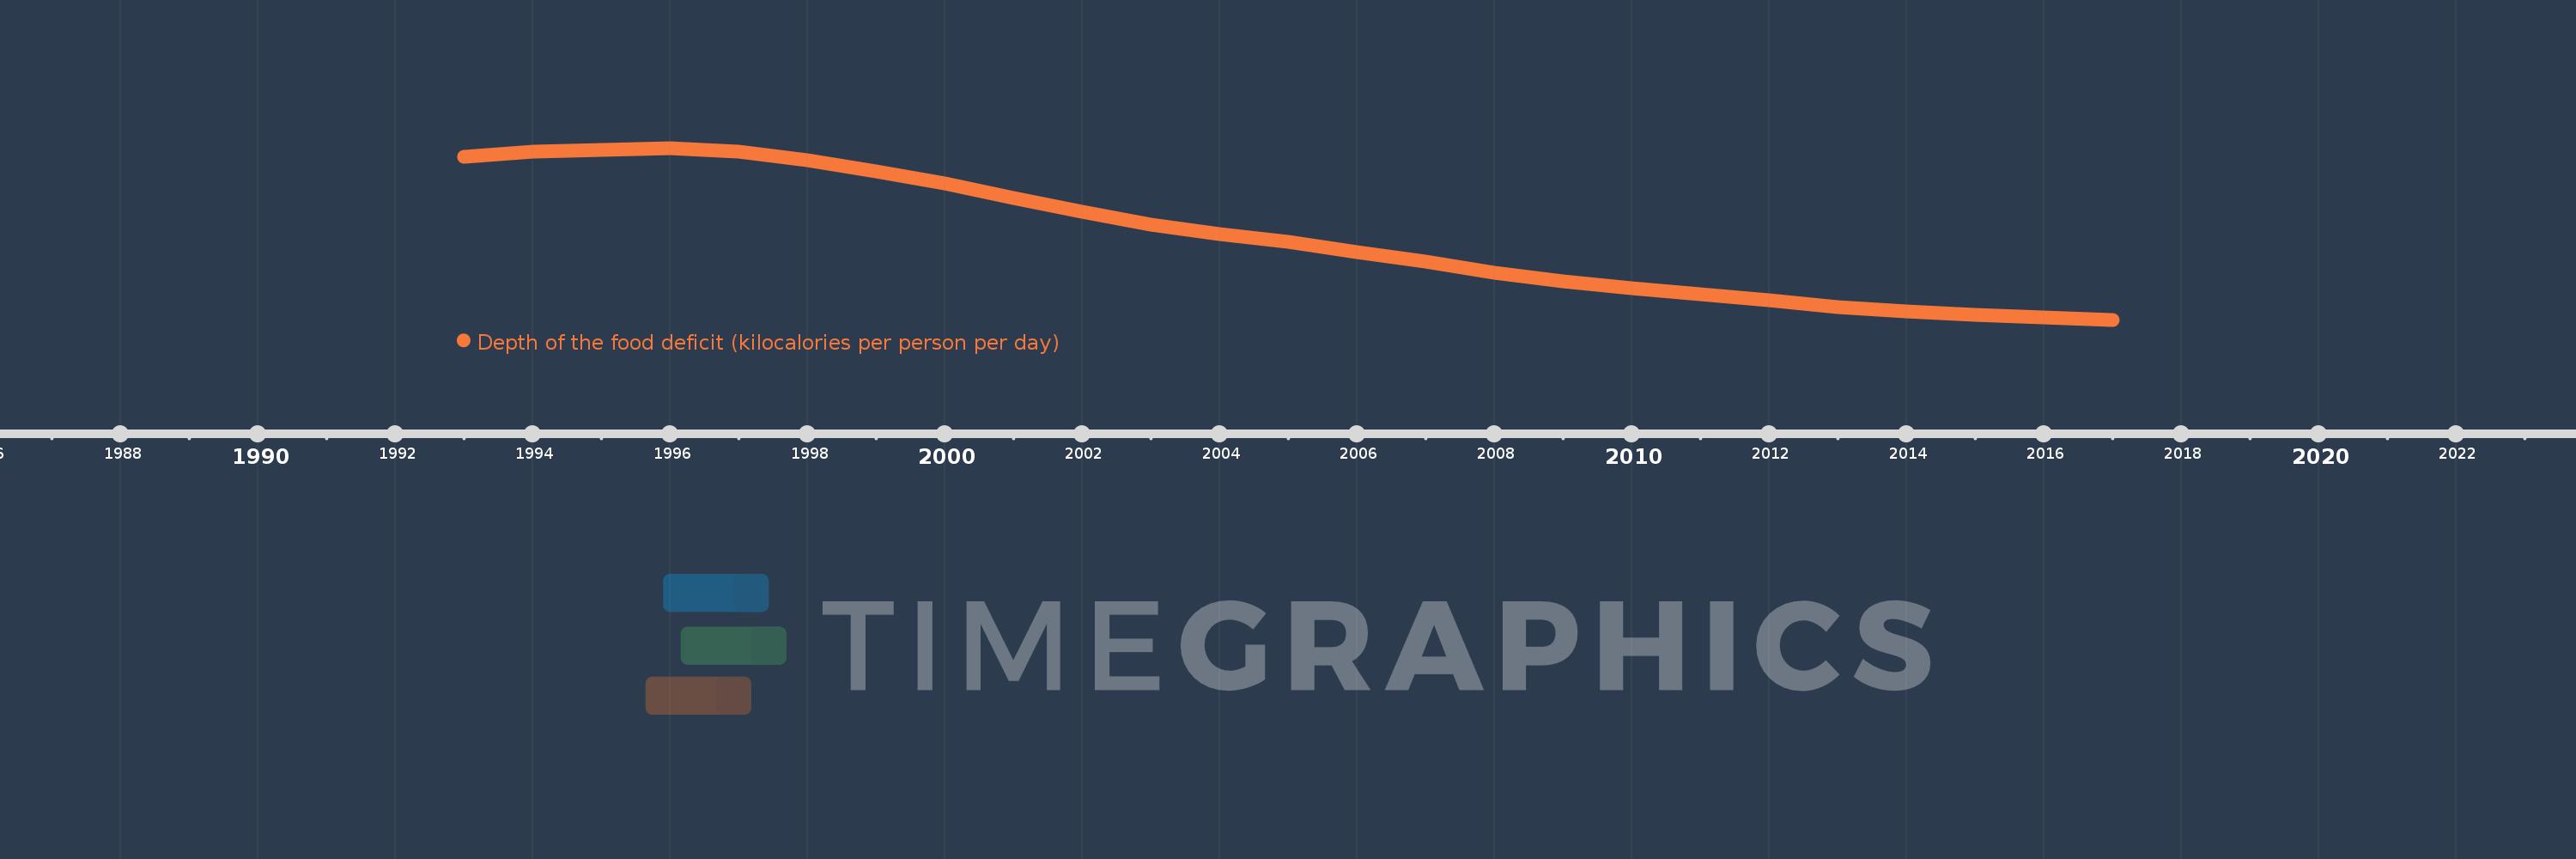
Depth of the food deficit (kilocalories per person per day)
2017,2016,2015,2014,2013,2012,2011,2010,2009,2008,2007,2006,2005,2004,2003,2002,2001,2000,1999,1998,1997,1996,1995,1994,1993
This statistics in other country:
Timeline:
This timeline shows a graph from 1993 to 2017 of IDA only. No data until 1992. Number of actual observations by date: 25.
Source name:
World Development Indicators
Source organization:
Food and Agriculture Organization, Food Security Statistics.
Categories, topics:
Health
Last updated:
apr 23, 2017
Indicators value changes by year
Minimum:
155.356
jan 1, 2017
Maximum:
302.343
jan 1, 1996
At the date of observation
Value
Absolute change
Change from previous value
jan 1, 1993
294.557
+294.557
0.0%
jan 1, 1994
298.848
+4.29
1.46%
jan 1, 1995
300.882
+2.034
0.68%
jan 1, 1996
302.343
+1.461
0.49%
jan 1, 1997
298.937
-3.406
-1.13%
jan 1, 1998
292.002
-6.935
-2.32%
jan 1, 1999
282.564
-9.438
-3.23%
jan 1, 2000
272.17
-10.394
-3.68%
jan 1, 2001
259.808
-12.361
-4.54%
jan 1, 2002
247.448
-12.36
-4.76%
jan 1, 2003
236.929
-10.519
-4.25%
jan 1, 2004
228.96
-7.969
-3.36%
jan 1, 2005
221.692
-7.269
-3.17%
jan 1, 2006
213.265
-8.427
-3.8%
jan 1, 2007
204.812
-8.453
-3.96%
jan 1, 2008
195.649
-9.163
-4.47%
jan 1, 2009
188.435
-7.214
-3.69%
jan 1, 2010
182.547
-5.888
-3.12%
jan 1, 2011
177.276
-5.271
-2.89%
jan 1, 2012
171.88
-5.396
-3.04%
jan 1, 2013
166.355
-5.525
-3.21%
jan 1, 2014
162.281
-4.074
-2.45%
jan 1, 2015
159.521
-2.76
-1.7%
jan 1, 2016
157.547
-1.974
-1.24%
jan 1, 2017
155.356
-2.191
-1.39%
Ranking of countries by current statistics by years


Comments: