29
/
en
AIzaSyAYiBZKx7MnpbEhh9jyipgxe19OcubqV5w
April 1, 2024
26411
Early-demographic dividend
EAR
false
2
1
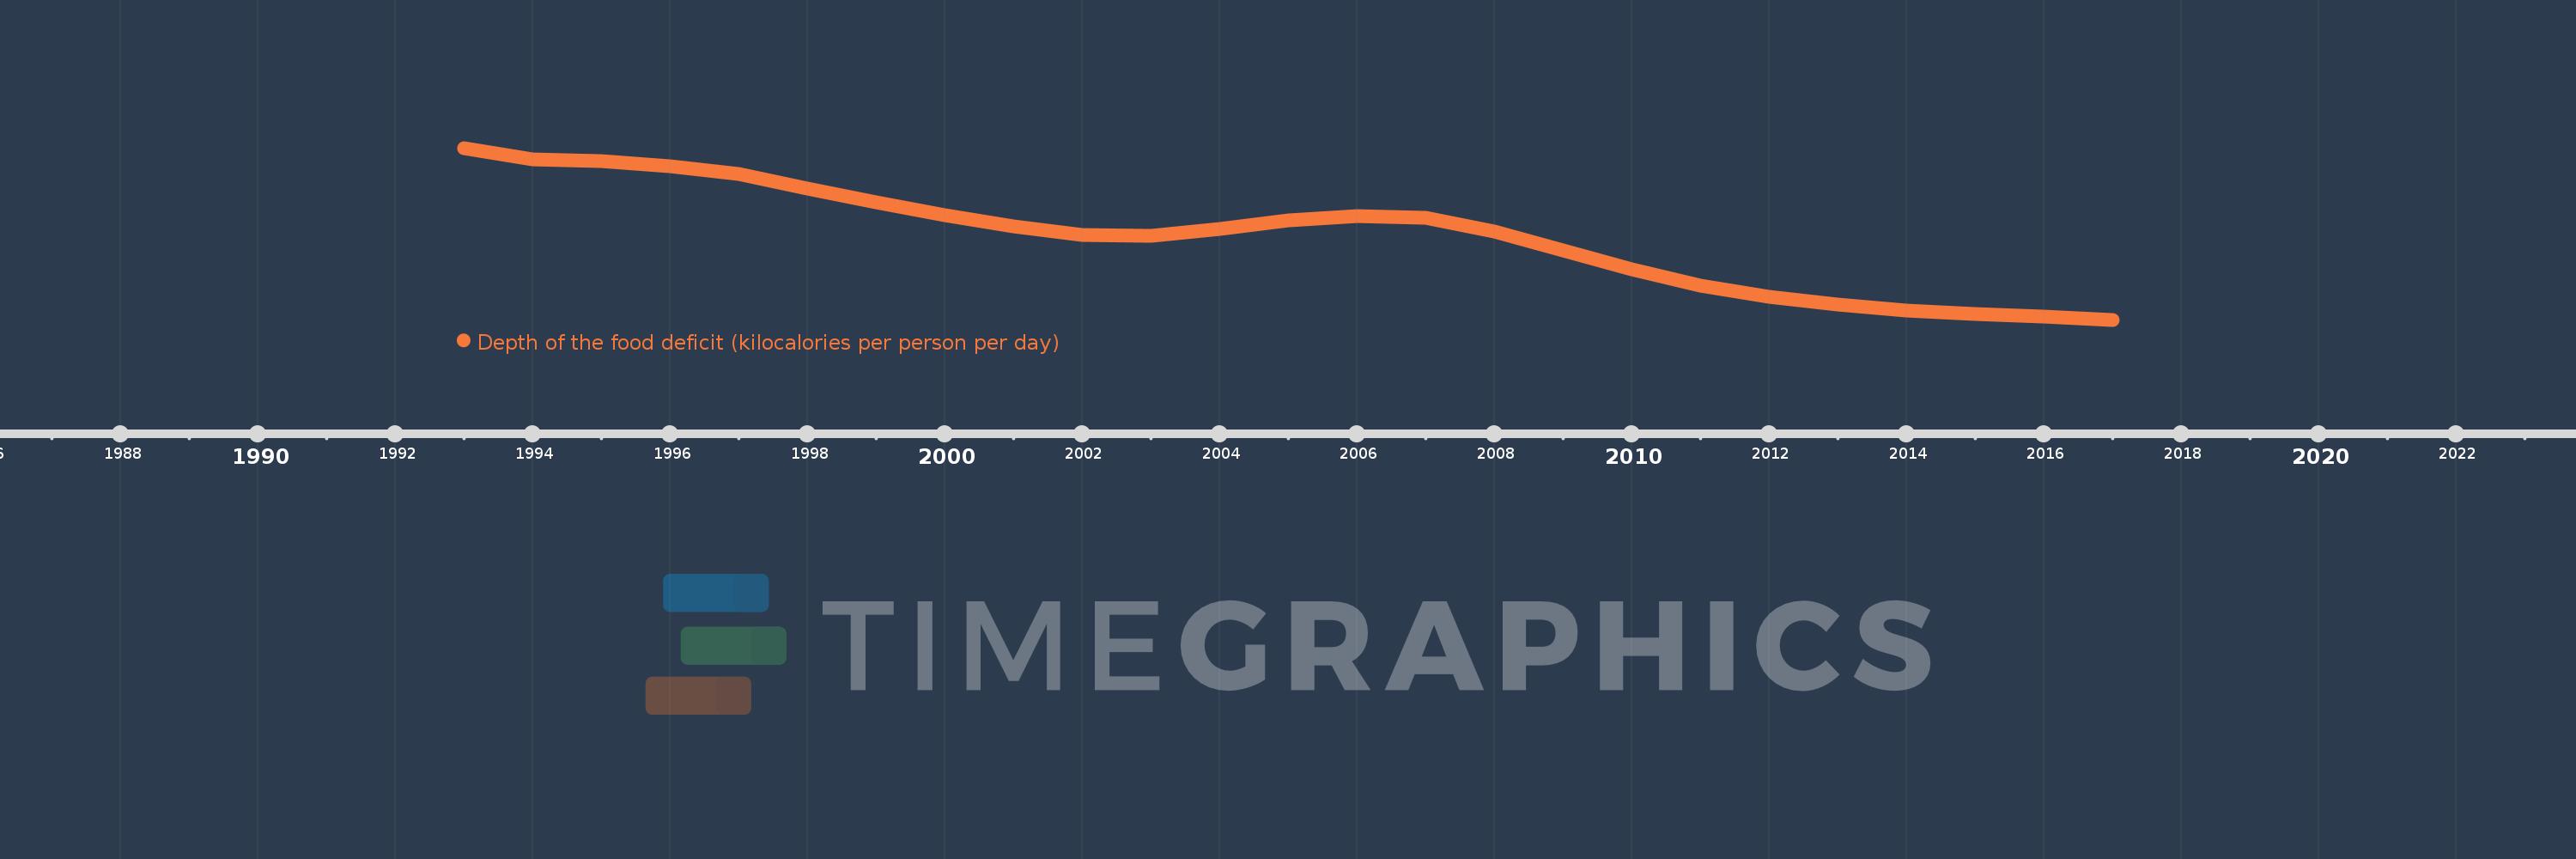
Depth of the food deficit (kilocalories per person per day)
2017,2016,2015,2014,2013,2012,2011,2010,2009,2008,2007,2006,2005,2004,2003,2002,2001,2000,1999,1998,1997,1996,1995,1994,1993
This statistics in other country:
Timeline:
This timeline shows a graph from 1993 to 2017 of Early-demographic dividend. No data until 1992. Number of actual observations by date: 25.
Source name:
World Development Indicators
Source organization:
Food and Agriculture Organization, Food Security Statistics.
Categories, topics:
Health
Last updated:
apr 23, 2017
Indicators value changes by year
Minimum:
94.741
jan 1, 2017
Maximum:
165.681
jan 1, 1993
At the date of observation
Value
Absolute change
Change from previous value
jan 1, 1993
165.681
+165.681
0.0%
jan 1, 1994
160.888
-4.793
-2.89%
jan 1, 1995
160.3
-0.588
-0.37%
jan 1, 1996
158.27
-2.03
-1.27%
jan 1, 1997
154.935
-3.335
-2.11%
jan 1, 1998
148.978
-5.957
-3.84%
jan 1, 1999
143.083
-5.895
-3.96%
jan 1, 2000
137.91
-5.173
-3.62%
jan 1, 2001
133.251
-4.659
-3.38%
jan 1, 2002
129.764
-3.487
-2.62%
jan 1, 2003
129.347
-0.417
-0.32%
jan 1, 2004
132.391
+3.043
2.35%
jan 1, 2005
135.943
+3.552
2.68%
jan 1, 2006
137.718
+1.776
1.31%
jan 1, 2007
136.765
-0.953
-0.69%
jan 1, 2008
131.246
-5.519
-4.04%
jan 1, 2009
123.398
-7.848
-5.98%
jan 1, 2010
115.435
-7.963
-6.45%
jan 1, 2011
108.999
-6.436
-5.58%
jan 1, 2012
104.298
-4.701
-4.31%
jan 1, 2013
100.98
-3.318
-3.18%
jan 1, 2014
98.552
-2.428
-2.4%
jan 1, 2015
97.171
-1.381
-1.4%
jan 1, 2016
96.086
-1.085
-1.12%
jan 1, 2017
94.741
-1.345
-1.4%
Ranking of countries by current statistics by years


Comments: