29
/
en
AIzaSyAYiBZKx7MnpbEhh9jyipgxe19OcubqV5w
April 1, 2024
113451
Cote d'Ivoire
CIV
true
2
1
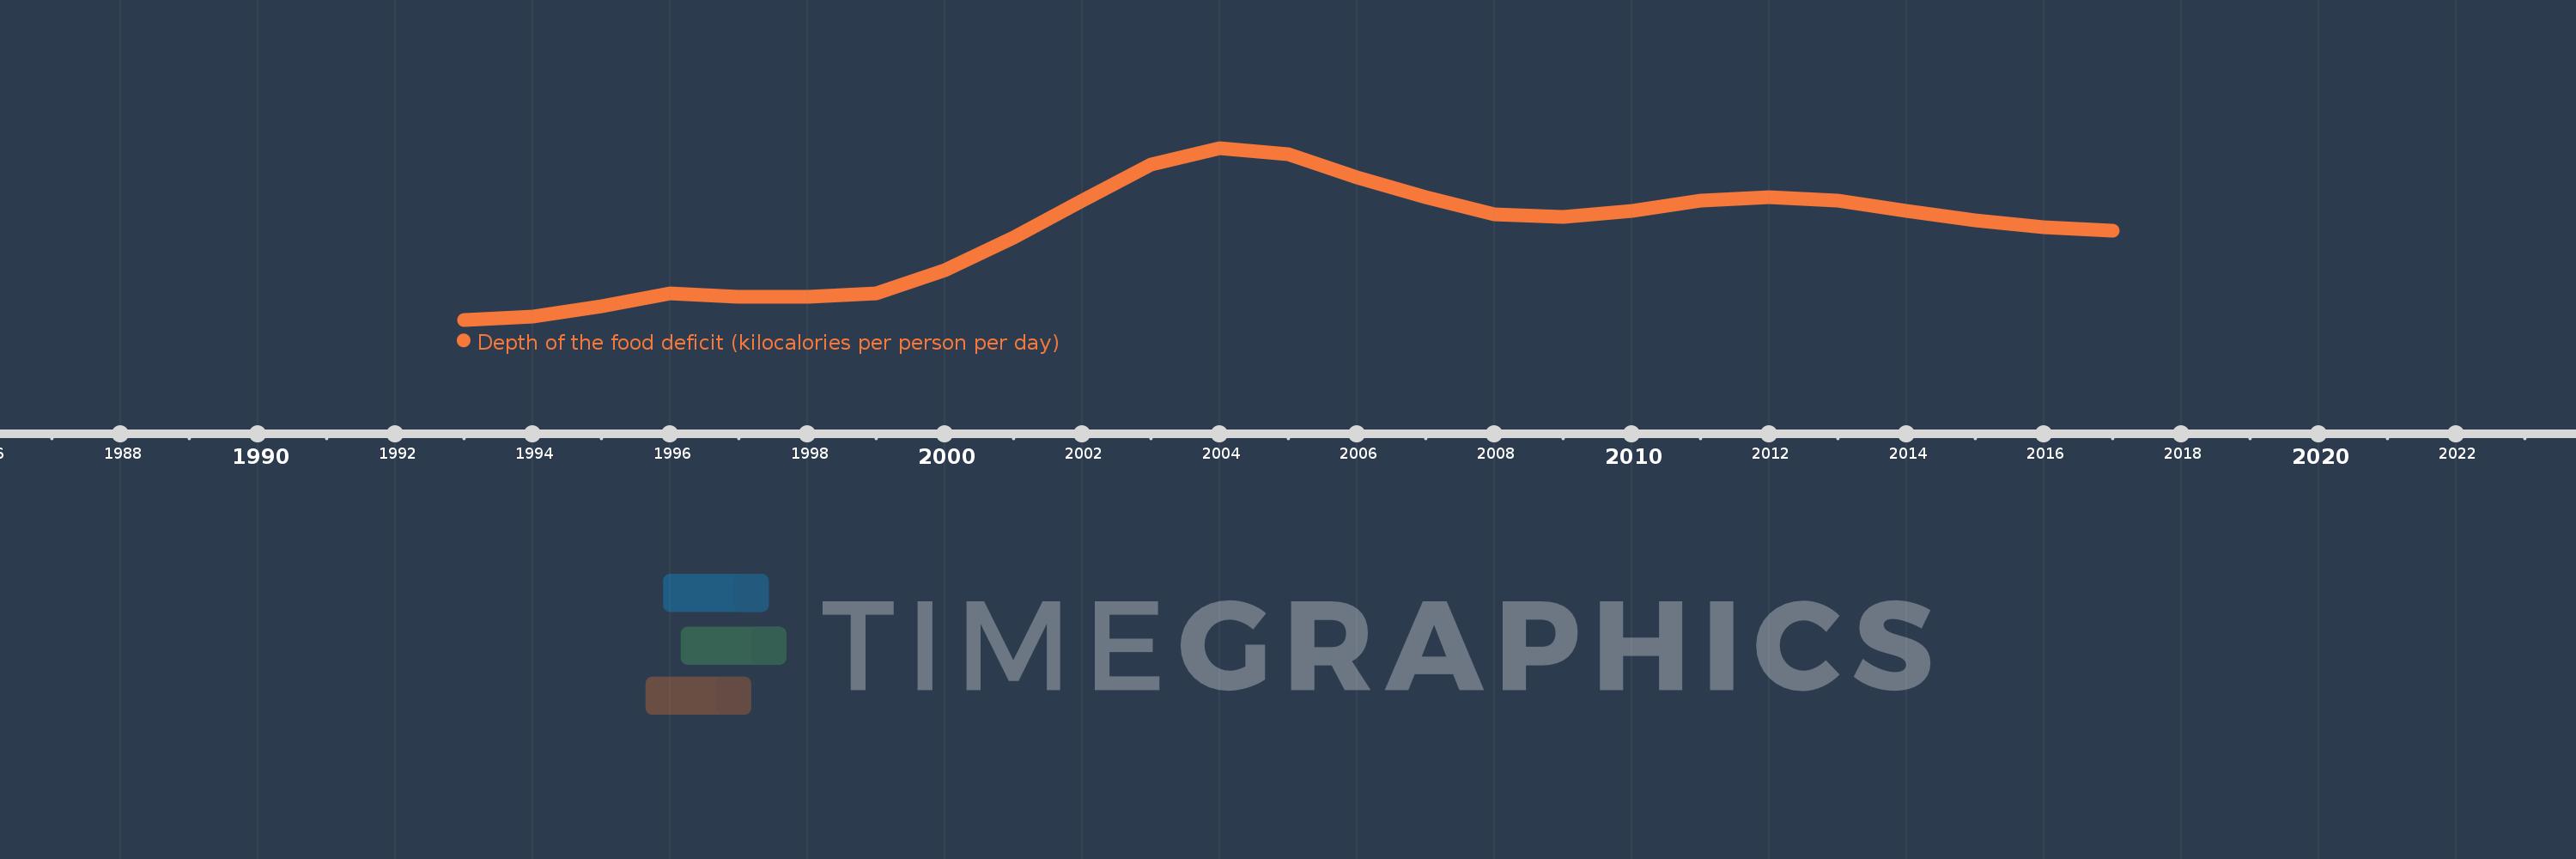
Depth of the food deficit (kilocalories per person per day)
2017,2016,2015,2014,2013,2012,2011,2010,2009,2008,2007,2006,2005,2004,2003,2002,2001,2000,1999,1998,1997,1996,1995,1994,1993
This statistics in other country:
Timeline:
This timeline shows a graph from 1993 to 2017 of Cote d'Ivoire. No data until 1992. Number of actual observations by date: 25.
Source name:
World Development Indicators
Source organization:
Food and Agriculture Organization, Food Security Statistics.
Categories, topics:
Health
Last updated:
apr 23, 2017
Indicators value changes by year
At the date of observation
Value
Absolute change
Change from previous value
jan 1, 1993
66.0
+66.0
0.0%
jan 1, 1994
67.0
+1.0
1.52%
jan 1, 1995
70.0
+3.0
4.48%
jan 1, 1996
74.0
+4.0
5.71%
jan 1, 1997
73.0
-1.0
-1.35%
jan 1, 1999
74.0
+1.0
1.37%
jan 1, 2000
81.0
+7.0
9.46%
jan 1, 2001
91.0
+10.0
12.35%
jan 1, 2002
102.0
+11.0
12.09%
jan 1, 2003
113.0
+11.0
10.78%
jan 1, 2004
118.0
+5.0
4.42%
jan 1, 2005
116.0
-2.0
-1.69%
jan 1, 2006
109.0
-7.0
-6.03%
jan 1, 2007
103.0
-6.0
-5.5%
jan 1, 2008
98.0
-5.0
-4.85%
jan 1, 2009
97.0
-1.0
-1.02%
jan 1, 2010
99.0
+2.0
2.06%
jan 1, 2011
102.0
+3.0
3.03%
jan 1, 2012
103.0
+1.0
0.98%
jan 1, 2013
102.0
-1.0
-0.97%
jan 1, 2014
99.0
-3.0
-2.94%
jan 1, 2015
96.0
-3.0
-3.03%
jan 1, 2016
94.0
-2.0
-2.08%
jan 1, 2017
93.0
-1.0
-1.06%
Ranking of countries by current statistics by years


Comments: