29
/
en
AIzaSyAYiBZKx7MnpbEhh9jyipgxe19OcubqV5w
April 1, 2024
97209
Cabo Verde
CPV
true
2
1
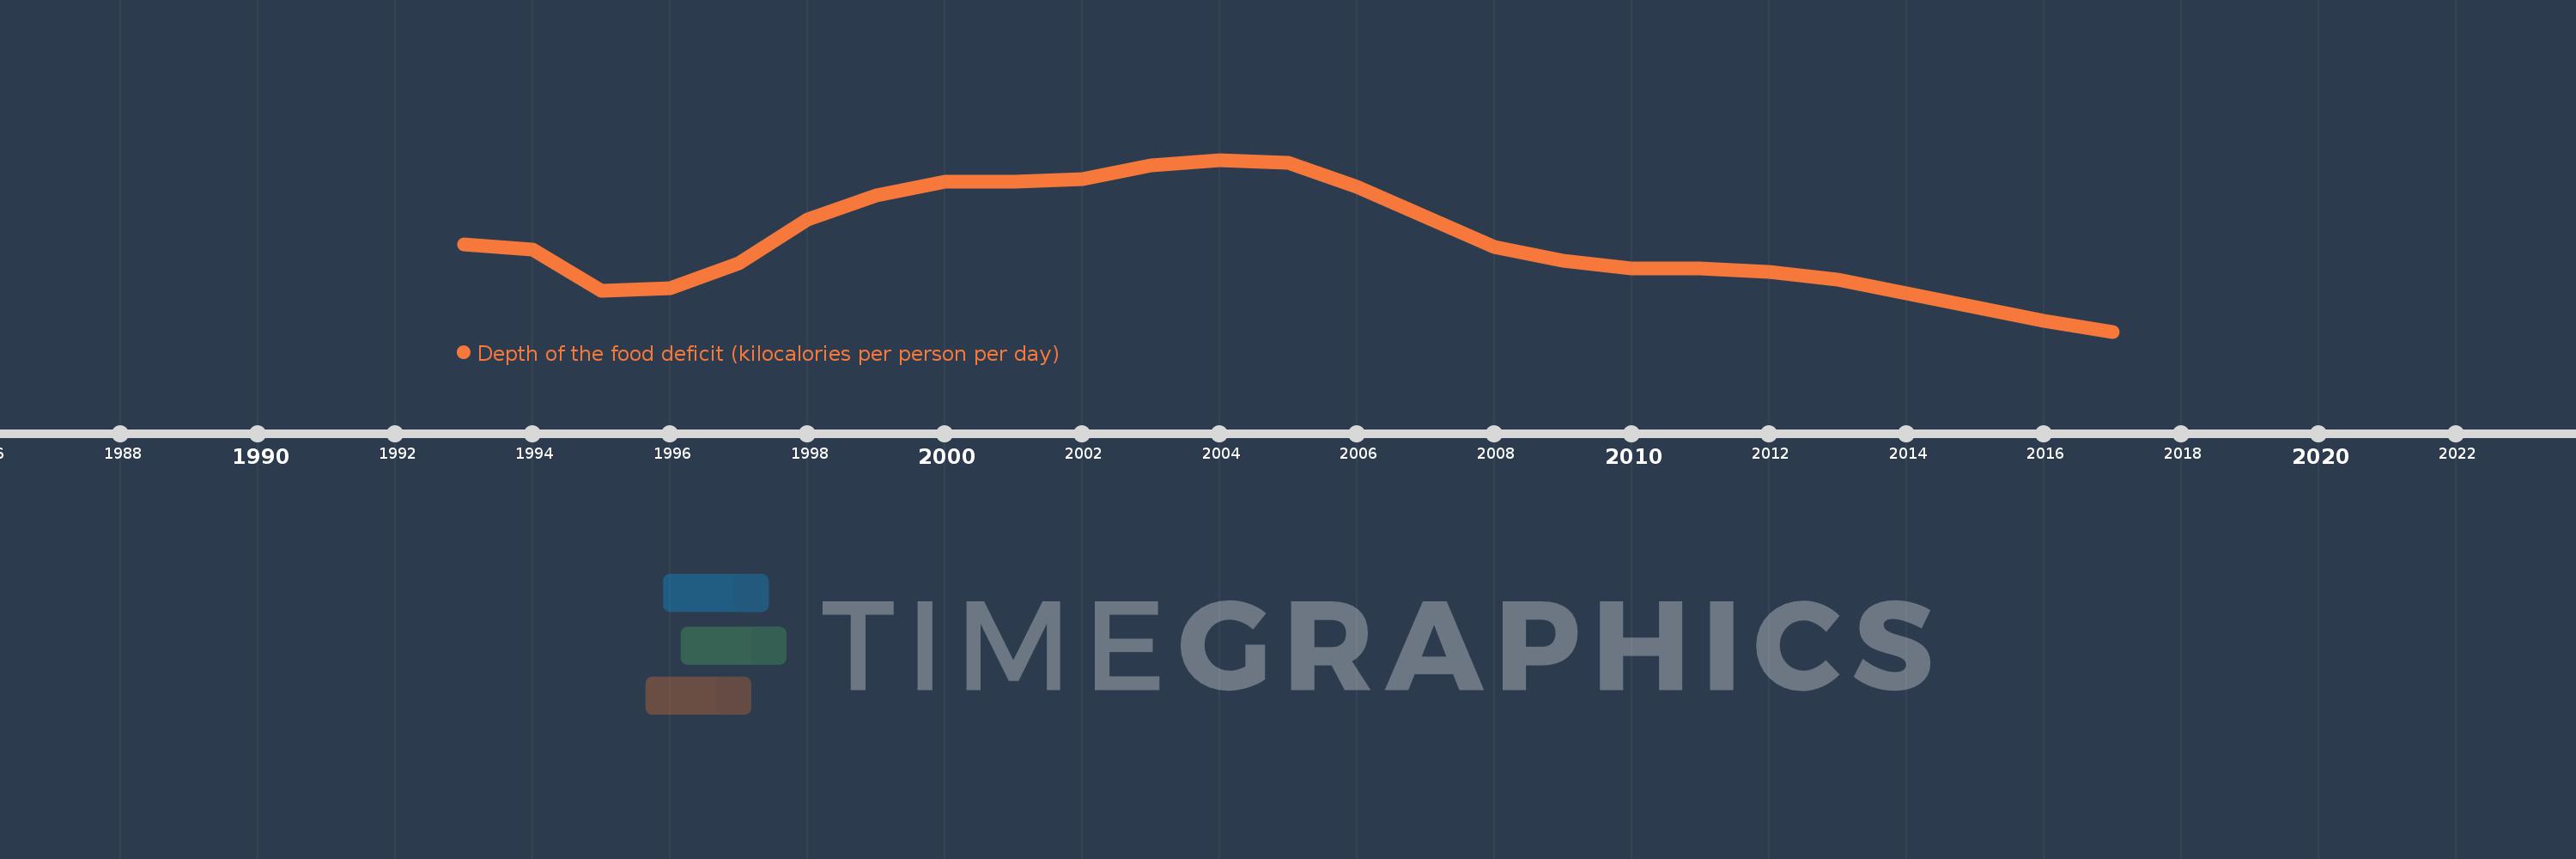
Depth of the food deficit (kilocalories per person per day)
2017,2016,2015,2014,2013,2012,2011,2010,2009,2008,2007,2006,2005,2004,2003,2002,2001,2000,1999,1998,1997,1996,1995,1994,1993
This statistics in other country:
Timeline:
This timeline shows a graph from 1993 to 2017 of Cabo Verde. No data until 1992. Number of actual observations by date: 25.
Source name:
World Development Indicators
Source organization:
Food and Agriculture Organization, Food Security Statistics.
Categories, topics:
Health
Last updated:
apr 23, 2017
Indicators value changes by year
At the date of observation
Value
Absolute change
Change from previous value
jan 1, 1993
100.0
+100.0
0.0%
jan 1, 1994
98.0
-2.0
-2.0%
jan 1, 1995
83.0
-15.0
-15.31%
jan 1, 1996
84.0
+1.0
1.2%
jan 1, 1997
93.0
+9.0
10.71%
jan 1, 1998
109.0
+16.0
17.2%
jan 1, 1999
118.0
+9.0
8.26%
jan 1, 2000
123.0
+5.0
4.24%
jan 1, 2001
123.0
0.0
0.0%
jan 1, 2002
124.0
+1.0
0.81%
jan 1, 2003
129.0
+5.0
4.03%
jan 1, 2004
131.0
+2.0
1.55%
jan 1, 2005
130.0
-1.0
-0.76%
jan 1, 2006
121.0
-9.0
-6.92%
jan 1, 2007
110.0
-11.0
-9.09%
jan 1, 2008
99.0
-11.0
-10.0%
jan 1, 2009
94.0
-5.0
-5.05%
jan 1, 2010
91.0
-3.0
-3.19%
jan 1, 2012
90.0
-1.0
-1.1%
jan 1, 2013
87.0
-3.0
-3.33%
jan 1, 2014
82.0
-5.0
-5.75%
jan 1, 2015
77.0
-5.0
-6.1%
jan 1, 2016
72.0
-5.0
-6.49%
jan 1, 2017
68.0
-4.0
-5.56%
Ranking of countries by current statistics by years


Comments: