29
/
en
AIzaSyAYiBZKx7MnpbEhh9jyipgxe19OcubqV5w
April 1, 2024
82629
Belize
BLZ
true
2
1
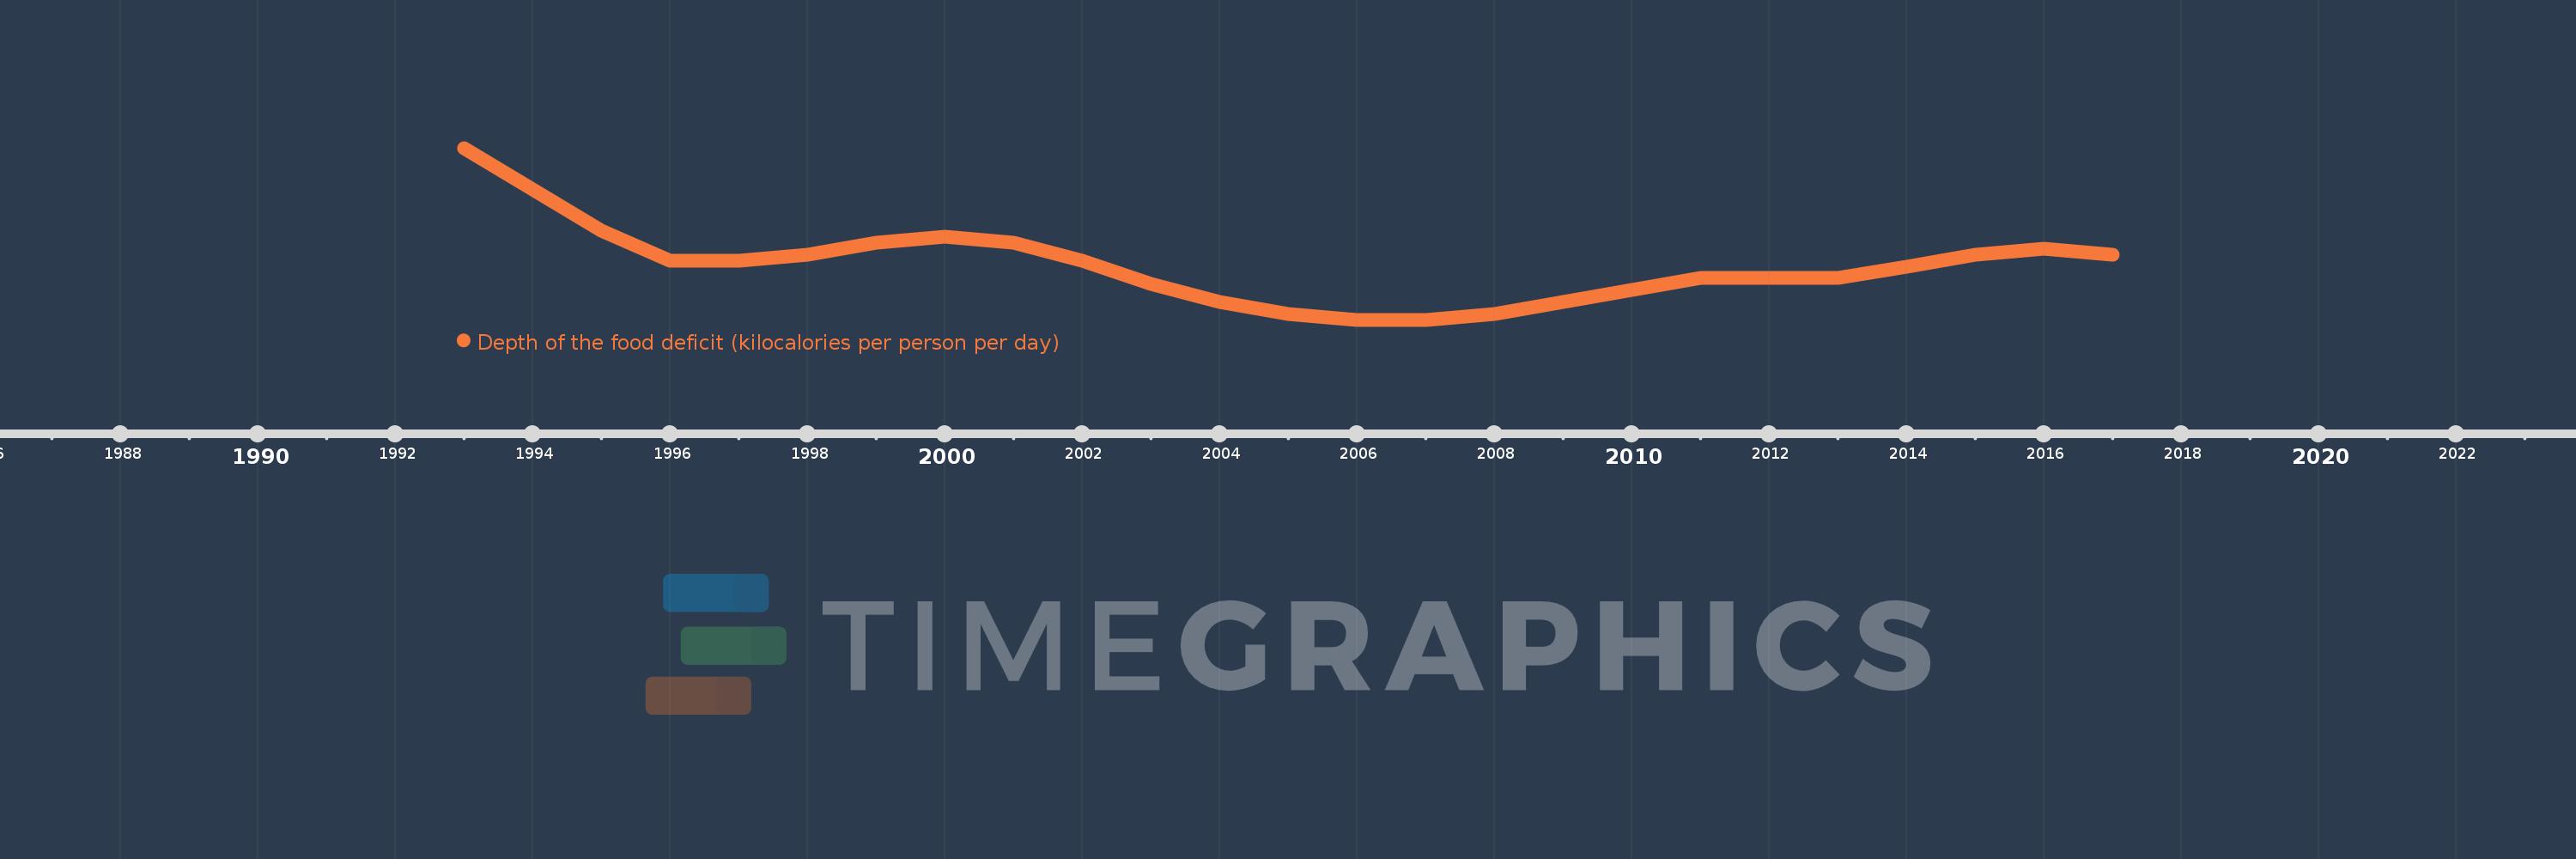
Depth of the food deficit (kilocalories per person per day)
2017,2016,2015,2014,2013,2012,2011,2010,2009,2008,2007,2006,2005,2004,2003,2002,2001,2000,1999,1998,1997,1996,1995,1994,1993
This statistics in other country:
Timeline:
This timeline shows a graph from 1993 to 2017 of Belize. No data until 1992. Number of actual observations by date: 25.
Source name:
World Development Indicators
Source organization:
Food and Agriculture Organization, Food Security Statistics.
Categories, topics:
Health
Last updated:
apr 23, 2017
Indicators value changes by year
At the date of observation
Value
Absolute change
Change from previous value
jan 1, 1993
58.0
+58.0
0.0%
jan 1, 1994
51.0
-7.0
-12.07%
jan 1, 1995
44.0
-7.0
-13.73%
jan 1, 1996
39.0
-5.0
-11.36%
jan 1, 1998
40.0
+1.0
2.56%
jan 1, 1999
42.0
+2.0
5.0%
jan 1, 2000
43.0
+1.0
2.38%
jan 1, 2001
42.0
-1.0
-2.33%
jan 1, 2002
39.0
-3.0
-7.14%
jan 1, 2003
35.0
-4.0
-10.26%
jan 1, 2004
32.0
-3.0
-8.57%
jan 1, 2005
30.0
-2.0
-6.25%
jan 1, 2006
29.0
-1.0
-3.33%
jan 1, 2008
30.0
+1.0
3.45%
jan 1, 2009
32.0
+2.0
6.67%
jan 1, 2010
34.0
+2.0
6.25%
jan 1, 2011
36.0
+2.0
5.88%
jan 1, 2014
38.0
+2.0
5.56%
jan 1, 2015
40.0
+2.0
5.26%
jan 1, 2016
41.0
+1.0
2.5%
jan 1, 2017
40.0
-1.0
-2.44%
Ranking of countries by current statistics by years


Comments: