29
/
en
AIzaSyAYiBZKx7MnpbEhh9jyipgxe19OcubqV5w
April 1, 2024
243502
Solomon Islands
SLB
true
2
1
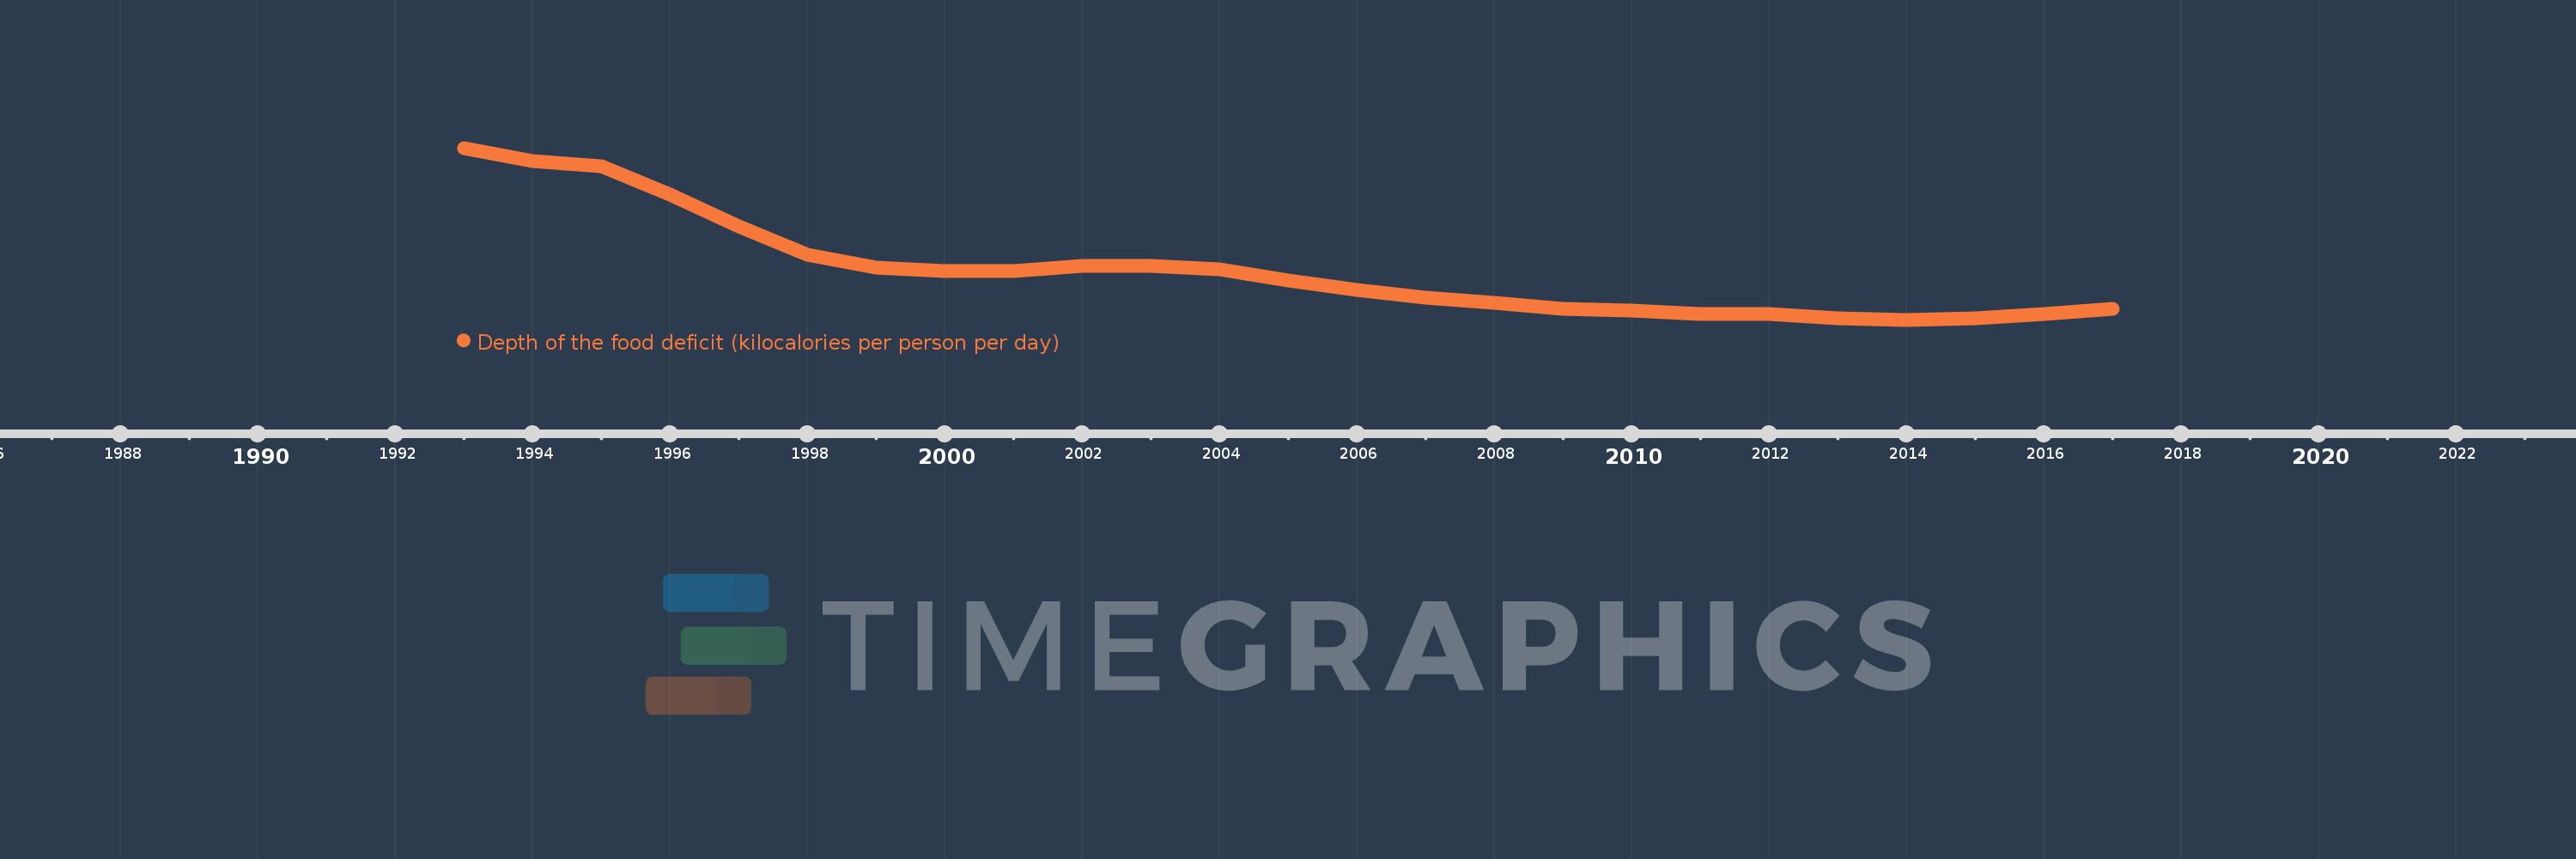
Depth of the food deficit (kilocalories per person per day)
2017,2016,2015,2014,2013,2012,2011,2010,2009,2008,2007,2006,2005,2004,2003,2002,2001,2000,1999,1998,1997,1996,1995,1994,1993
This statistics in other country:
Timeline:
This timeline shows a graph from 1993 to 2017 of Solomon Islands. No data until 1992. Number of actual observations by date: 25.
Source name:
World Development Indicators
Source organization:
Food and Agriculture Organization, Food Security Statistics.
Categories, topics:
Health
Last updated:
apr 23, 2017
Indicators value changes by year
At the date of observation
Value
Absolute change
Change from previous value
jan 1, 1993
156.0
+156.0
0.0%
jan 1, 1994
149.0
-7.0
-4.49%
jan 1, 1995
146.0
-3.0
-2.01%
jan 1, 1996
131.0
-15.0
-10.27%
jan 1, 1997
114.0
-17.0
-12.98%
jan 1, 1998
99.0
-15.0
-13.16%
jan 1, 1999
92.0
-7.0
-7.07%
jan 1, 2000
90.0
-2.0
-2.17%
jan 1, 2002
93.0
+3.0
3.33%
jan 1, 2004
91.0
-2.0
-2.15%
jan 1, 2005
85.0
-6.0
-6.59%
jan 1, 2006
80.0
-5.0
-5.88%
jan 1, 2007
76.0
-4.0
-5.0%
jan 1, 2008
73.0
-3.0
-3.95%
jan 1, 2009
70.0
-3.0
-4.11%
jan 1, 2010
69.0
-1.0
-1.43%
jan 1, 2011
67.0
-2.0
-2.9%
jan 1, 2013
65.0
-2.0
-2.99%
jan 1, 2014
64.0
-1.0
-1.54%
jan 1, 2015
65.0
+1.0
1.56%
jan 1, 2016
67.0
+2.0
3.08%
jan 1, 2017
70.0
+3.0
4.48%
Ranking of countries by current statistics by years


Comments: