29
/
en
AIzaSyAYiBZKx7MnpbEhh9jyipgxe19OcubqV5w
April 1, 2024
38054
IDA blend
IDB
false
2
1
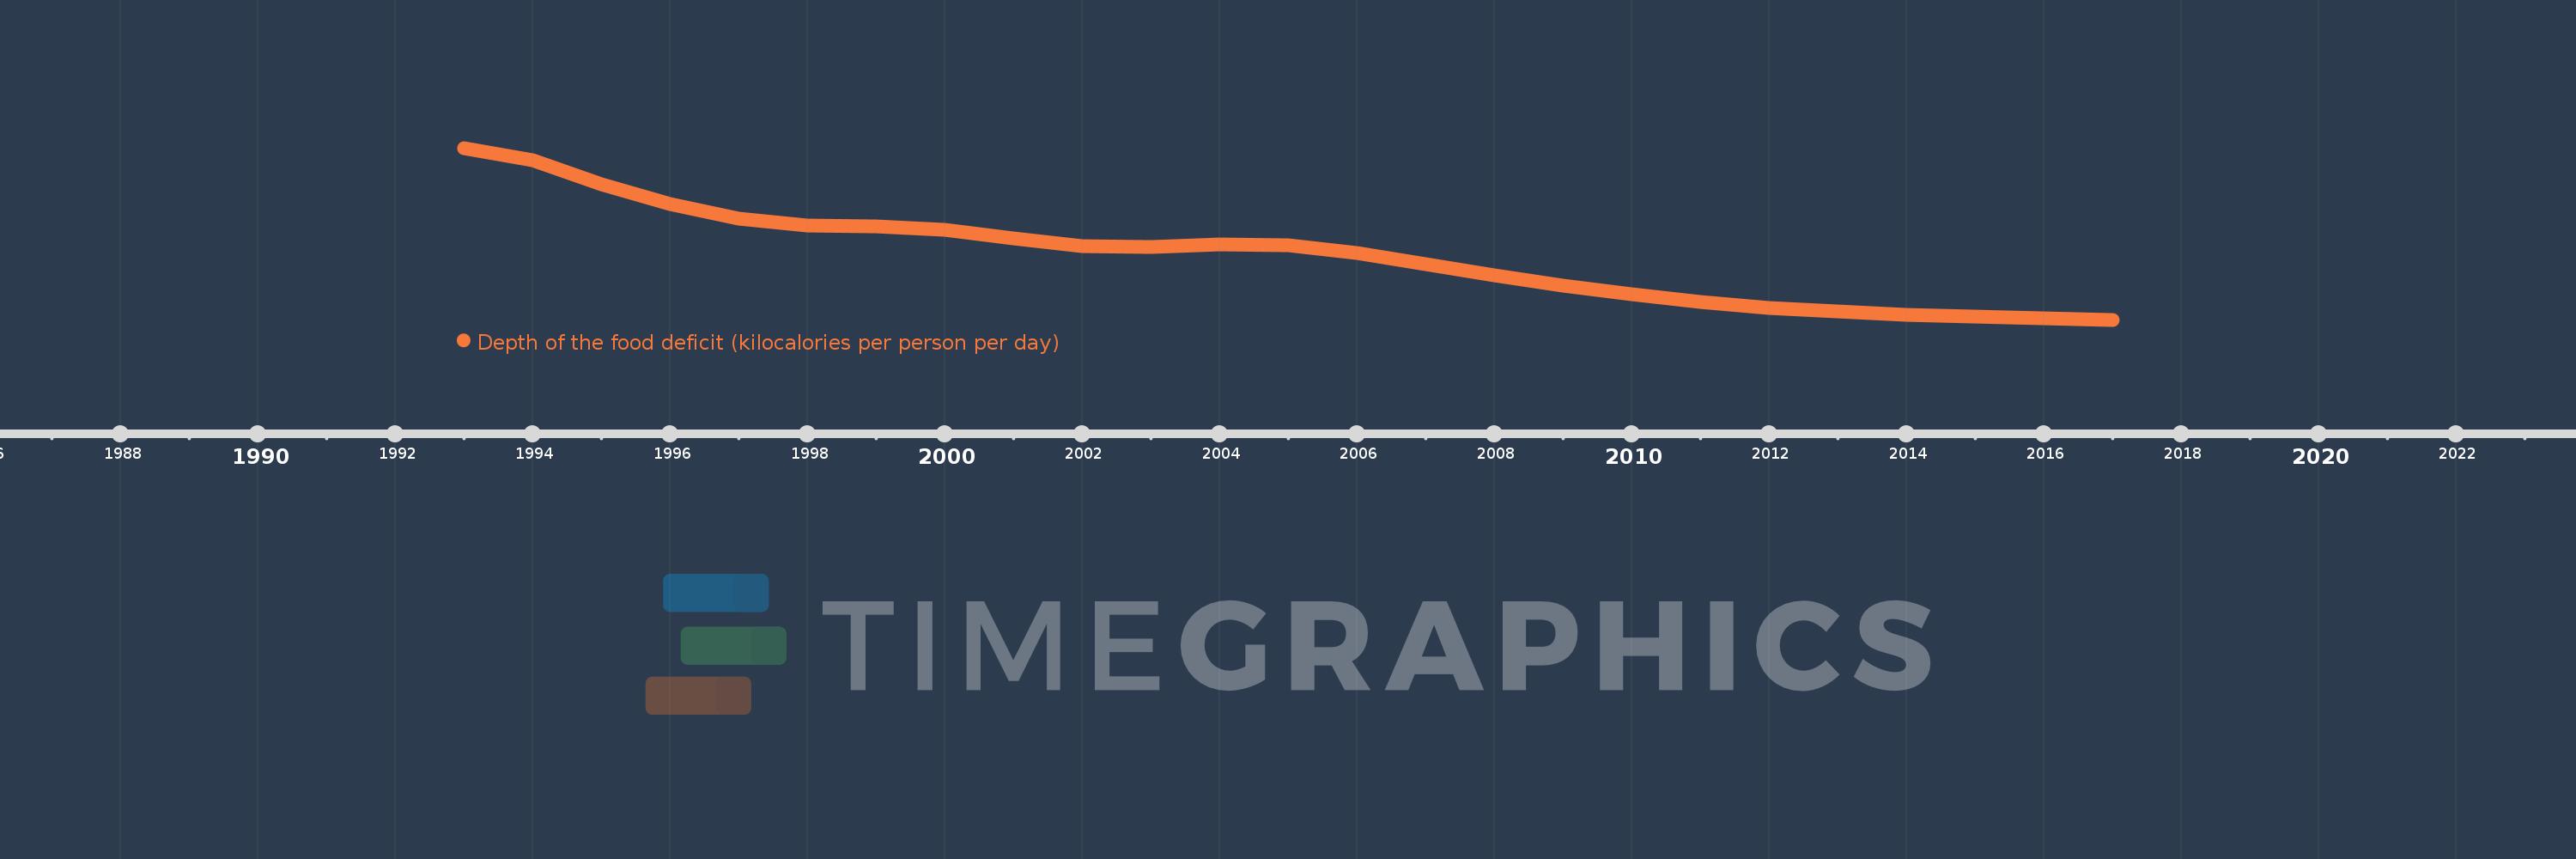
Depth of the food deficit (kilocalories per person per day)
2017,2016,2015,2014,2013,2012,2011,2010,2009,2008,2007,2006,2005,2004,2003,2002,2001,2000,1999,1998,1997,1996,1995,1994,1993
This statistics in other country:
Timeline:
This timeline shows a graph from 1993 to 2017 of IDA blend. No data until 1992. Number of actual observations by date: 25.
Source name:
World Development Indicators
Source organization:
Food and Agriculture Organization, Food Security Statistics.
Categories, topics:
Health
Last updated:
apr 23, 2017
Indicators value changes by year
Minimum:
106.148
jan 1, 2017
Maximum:
207.516
jan 1, 1993
At the date of observation
Value
Absolute change
Change from previous value
jan 1, 1993
207.516
+207.516
0.0%
jan 1, 1994
200.333
-7.184
-3.46%
jan 1, 1995
186.182
-14.151
-7.06%
jan 1, 1996
174.518
-11.664
-6.26%
jan 1, 1997
165.583
-8.935
-5.12%
jan 1, 1998
161.733
-3.85
-2.32%
jan 1, 1999
161.048
-0.685
-0.42%
jan 1, 2000
159.149
-1.899
-1.18%
jan 1, 2001
154.162
-4.987
-3.13%
jan 1, 2002
149.692
-4.469
-2.9%
jan 1, 2003
149.005
-0.687
-0.46%
jan 1, 2004
150.447
+1.442
0.97%
jan 1, 2005
149.906
-0.541
-0.36%
jan 1, 2006
145.392
-4.514
-3.01%
jan 1, 2007
138.849
-6.543
-4.5%
jan 1, 2008
132.48
-6.369
-4.59%
jan 1, 2009
126.415
-6.066
-4.58%
jan 1, 2010
121.071
-5.343
-4.23%
jan 1, 2011
116.873
-4.198
-3.47%
jan 1, 2012
113.336
-3.537
-3.03%
jan 1, 2013
110.901
-2.434
-2.15%
jan 1, 2014
109.117
-1.784
-1.61%
jan 1, 2015
108.129
-0.988
-0.91%
jan 1, 2016
106.883
-1.247
-1.15%
jan 1, 2017
106.148
-0.734
-0.69%
Ranking of countries by current statistics by years


Comments: