29
/
en
AIzaSyAYiBZKx7MnpbEhh9jyipgxe19OcubqV5w
April 1, 2024
54011
Pacific island small states
PSS
false
2
1
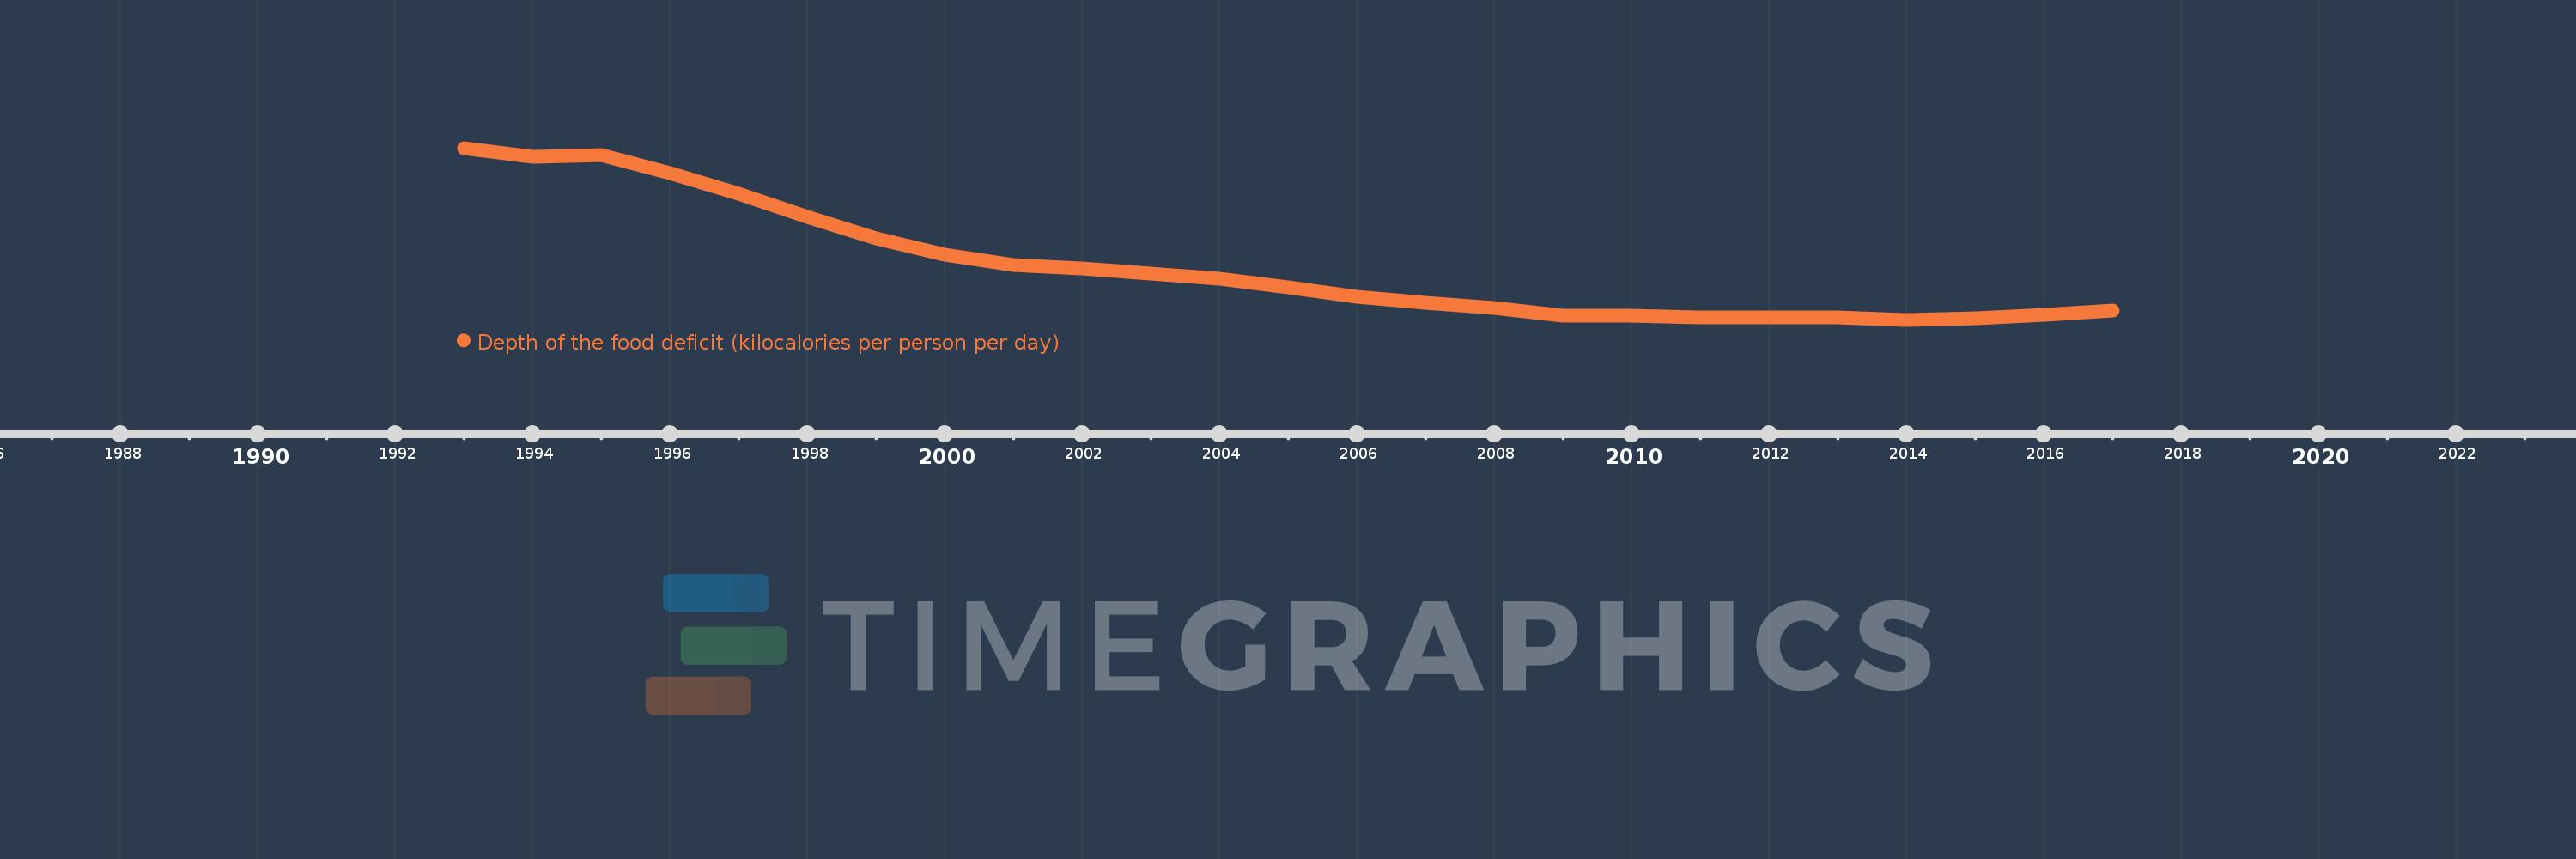
Depth of the food deficit (kilocalories per person per day)
2017,2016,2015,2014,2013,2012,2011,2010,2009,2008,2007,2006,2005,2004,2003,2002,2001,2000,1999,1998,1997,1996,1995,1994,1993
This statistics in other country:
Timeline:
This timeline shows a graph from 1993 to 2017 of Pacific island small states. No data until 1992. Number of actual observations by date: 25.
Source name:
World Development Indicators
Source organization:
Food and Agriculture Organization, Food Security Statistics.
Categories, topics:
Health
Last updated:
apr 23, 2017
Indicators value changes by year
Minimum:
39.893
jan 1, 2014
Maximum:
73.684
jan 1, 1993
At the date of observation
Value
Absolute change
Change from previous value
jan 1, 1993
73.684
+73.684
0.0%
jan 1, 1994
71.92
-1.764
-2.39%
jan 1, 1995
72.242
+0.322
0.45%
jan 1, 1996
68.685
-3.557
-4.92%
jan 1, 1997
64.707
-3.978
-5.79%
jan 1, 1998
60.15
-4.557
-7.04%
jan 1, 1999
55.921
-4.229
-7.03%
jan 1, 2000
52.693
-3.228
-5.77%
jan 1, 2001
50.709
-1.984
-3.77%
jan 1, 2002
50.052
-0.657
-1.3%
jan 1, 2003
48.952
-1.1
-2.2%
jan 1, 2004
47.924
-1.027
-2.1%
jan 1, 2005
46.33
-1.595
-3.33%
jan 1, 2006
44.457
-1.872
-4.04%
jan 1, 2007
43.263
-1.194
-2.69%
jan 1, 2008
42.17
-1.093
-2.53%
jan 1, 2009
40.643
-1.527
-3.62%
jan 1, 2010
40.603
-0.04
-0.1%
jan 1, 2011
40.371
-0.232
-0.57%
jan 1, 2012
40.402
+0.031
0.08%
jan 1, 2013
40.421
+0.019
0.05%
jan 1, 2014
39.893
-0.528
-1.31%
jan 1, 2015
40.203
+0.31
0.78%
jan 1, 2016
40.836
+0.633
1.57%
jan 1, 2017
41.727
+0.891
2.18%
Ranking of countries by current statistics by years


Comments: