29
/
en
AIzaSyAYiBZKx7MnpbEhh9jyipgxe19OcubqV5w
April 1, 2024
198967
Mongolia
MNG
true
2
1
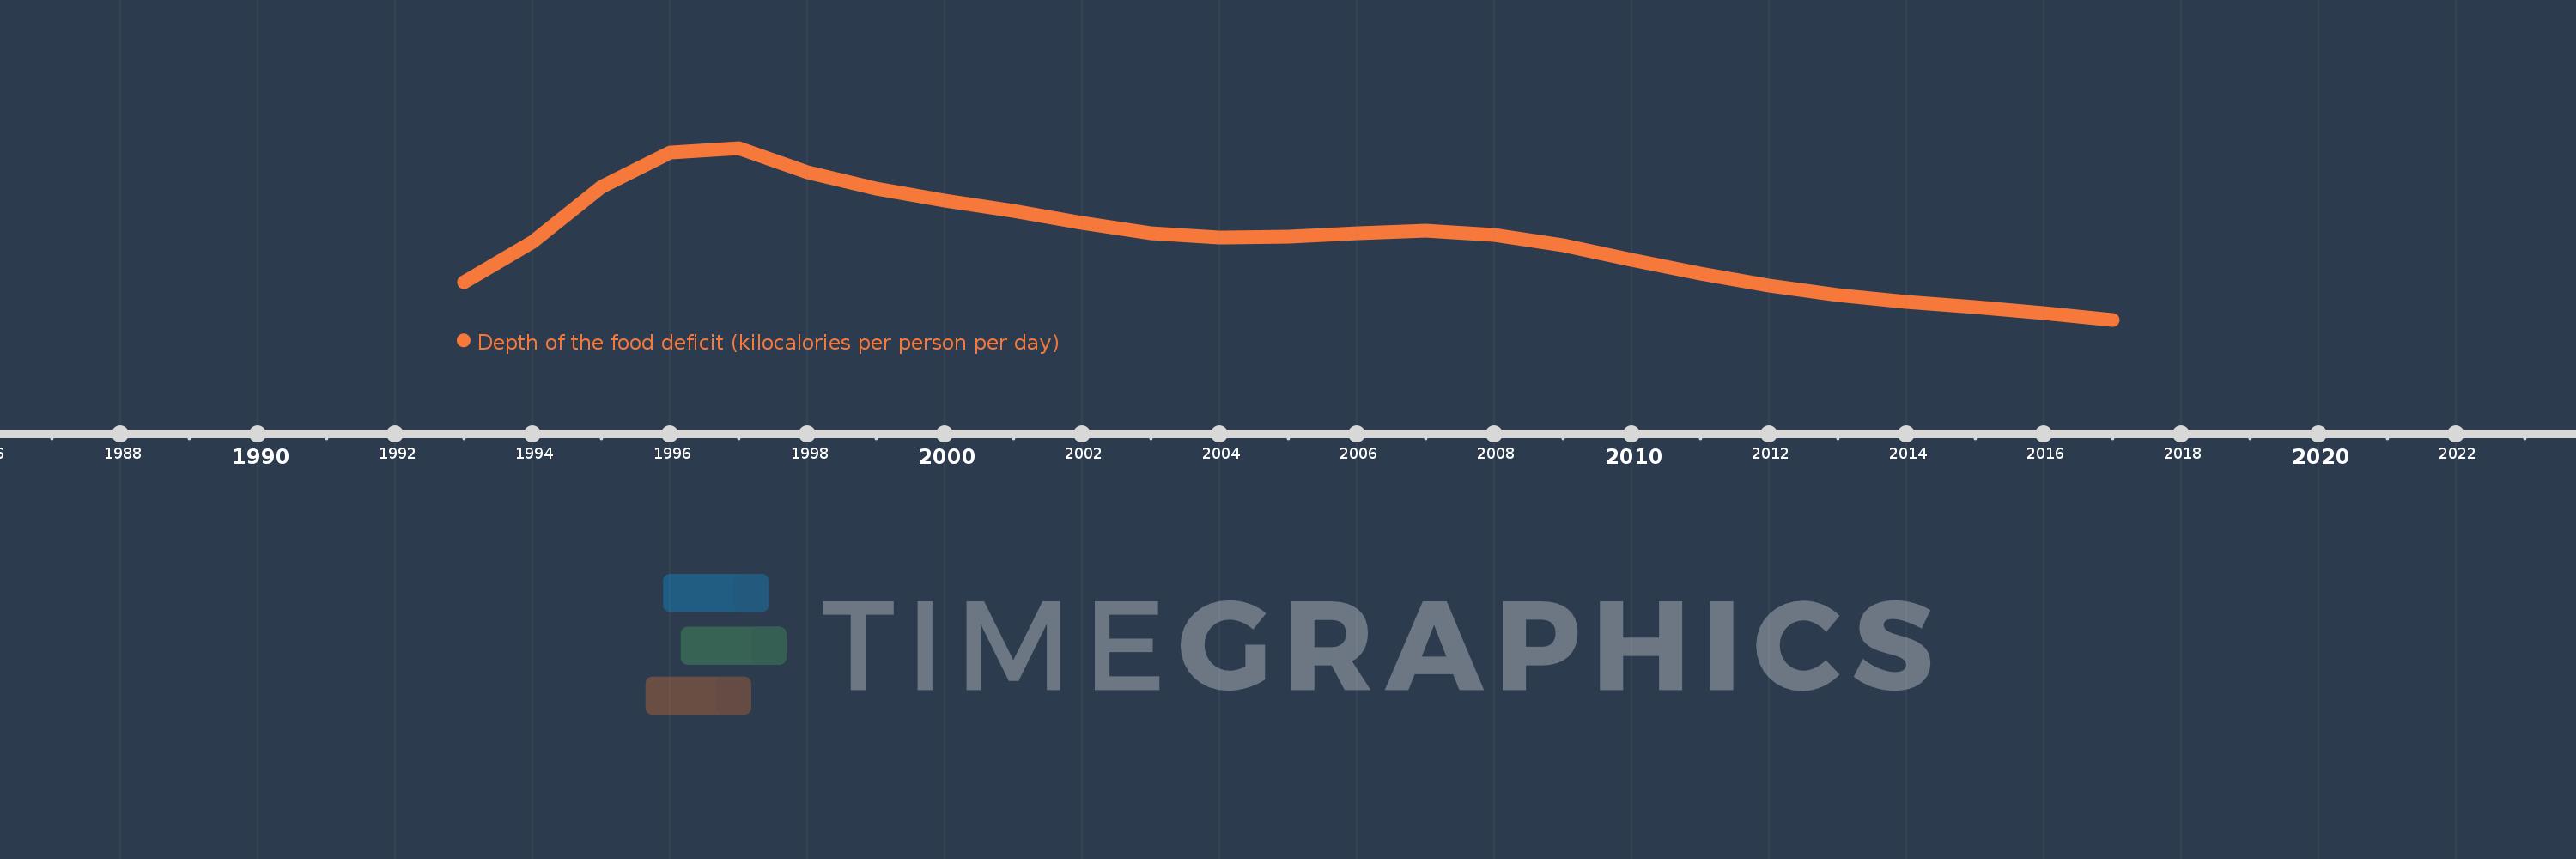
Depth of the food deficit (kilocalories per person per day)
2017,2016,2015,2014,2013,2012,2011,2010,2009,2008,2007,2006,2005,2004,2003,2002,2001,2000,1999,1998,1997,1996,1995,1994,1993
This statistics in other country:
Timeline:
This timeline shows a graph from 1993 to 2017 of Mongolia. No data until 1992. Number of actual observations by date: 25.
Source name:
World Development Indicators
Source organization:
Food and Agriculture Organization, Food Security Statistics.
Categories, topics:
Health
Last updated:
apr 23, 2017
Indicators value changes by year
At the date of observation
Value
Absolute change
Change from previous value
jan 1, 1993
210.0
+210.0
0.0%
jan 1, 1994
269.0
+59.0
28.1%
jan 1, 1995
348.0
+79.0
29.37%
jan 1, 1996
398.0
+50.0
14.37%
jan 1, 1997
404.0
+6.0
1.51%
jan 1, 1998
369.0
-35.0
-8.66%
jan 1, 1999
345.0
-24.0
-6.5%
jan 1, 2000
328.0
-17.0
-4.93%
jan 1, 2001
313.0
-15.0
-4.57%
jan 1, 2002
296.0
-17.0
-5.43%
jan 1, 2003
281.0
-15.0
-5.07%
jan 1, 2004
275.0
-6.0
-2.14%
jan 1, 2005
276.0
+1.0
0.36%
jan 1, 2006
281.0
+5.0
1.81%
jan 1, 2007
284.0
+3.0
1.07%
jan 1, 2008
278.0
-6.0
-2.11%
jan 1, 2009
264.0
-14.0
-5.04%
jan 1, 2010
243.0
-21.0
-7.95%
jan 1, 2011
223.0
-20.0
-8.23%
jan 1, 2012
205.0
-18.0
-8.07%
jan 1, 2013
192.0
-13.0
-6.34%
jan 1, 2014
182.0
-10.0
-5.21%
jan 1, 2015
174.0
-8.0
-4.4%
jan 1, 2016
165.0
-9.0
-5.17%
jan 1, 2017
156.0
-9.0
-5.45%
Ranking of countries by current statistics by years


Comments: