29
/
en
AIzaSyAYiBZKx7MnpbEhh9jyipgxe19OcubqV5w
April 1, 2024
42259
Latin America & Caribbean (excluding high income)
LAC
false
2
1
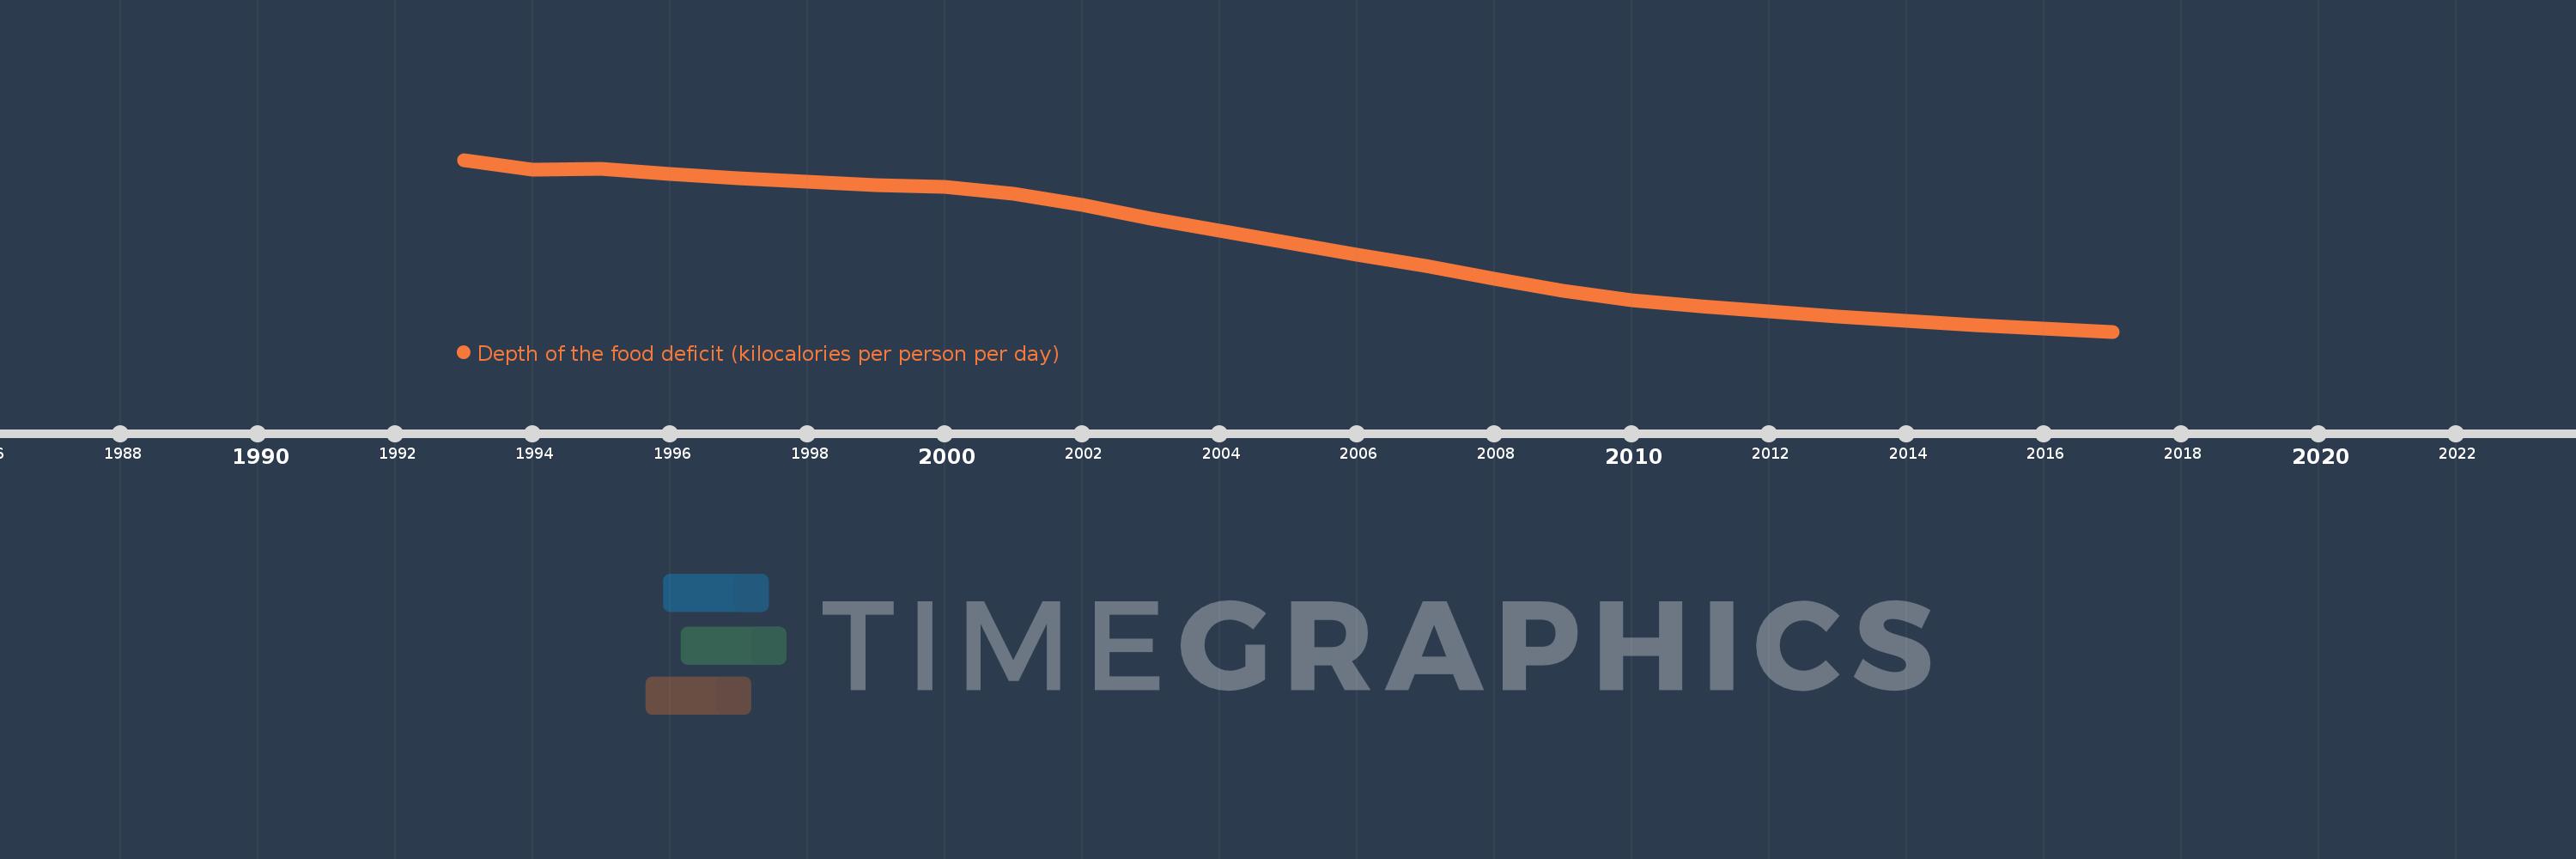
Depth of the food deficit (kilocalories per person per day)
2017,2016,2015,2014,2013,2012,2011,2010,2009,2008,2007,2006,2005,2004,2003,2002,2001,2000,1999,1998,1997,1996,1995,1994,1993
This statistics in other country:
Timeline:
This timeline shows a graph from 1993 to 2017 of Latin America & Caribbean (excluding high income). No data until 1992. Number of actual observations by date: 25.
Source name:
World Development Indicators
Source organization:
Food and Agriculture Organization, Food Security Statistics.
Categories, topics:
Health
Last updated:
apr 23, 2017
Indicators value changes by year
Minimum:
40.611
jan 1, 2017
Maximum:
107.125
jan 1, 1993
At the date of observation
Value
Absolute change
Change from previous value
jan 1, 1993
107.125
+107.125
0.0%
jan 1, 1994
103.305
-3.821
-3.57%
jan 1, 1995
103.526
+0.221
0.21%
jan 1, 1996
101.662
-1.864
-1.8%
jan 1, 1997
99.934
-1.729
-1.7%
jan 1, 1998
98.643
-1.291
-1.29%
jan 1, 1999
97.319
-1.324
-1.34%
jan 1, 2000
96.591
-0.728
-0.75%
jan 1, 2001
94.116
-2.476
-2.56%
jan 1, 2002
89.815
-4.301
-4.57%
jan 1, 2003
84.481
-5.334
-5.94%
jan 1, 2004
79.523
-4.957
-5.87%
jan 1, 2005
75.195
-4.329
-5.44%
jan 1, 2006
70.413
-4.781
-6.36%
jan 1, 2007
65.917
-4.496
-6.39%
jan 1, 2008
61.134
-4.783
-7.26%
jan 1, 2009
56.256
-4.878
-7.98%
jan 1, 2010
52.751
-3.506
-6.23%
jan 1, 2011
50.291
-2.46
-4.66%
jan 1, 2012
48.392
-1.899
-3.78%
jan 1, 2013
46.454
-1.938
-4.01%
jan 1, 2014
44.638
-1.816
-3.91%
jan 1, 2015
42.973
-1.665
-3.73%
jan 1, 2016
41.921
-1.051
-2.45%
jan 1, 2017
40.611
-1.311
-3.13%
Ranking of countries by current statistics by years


Comments: