29
/
en
AIzaSyAYiBZKx7MnpbEhh9jyipgxe19OcubqV5w
April 1, 2024
55434
Pre-demographic dividend
PRE
false
2
1
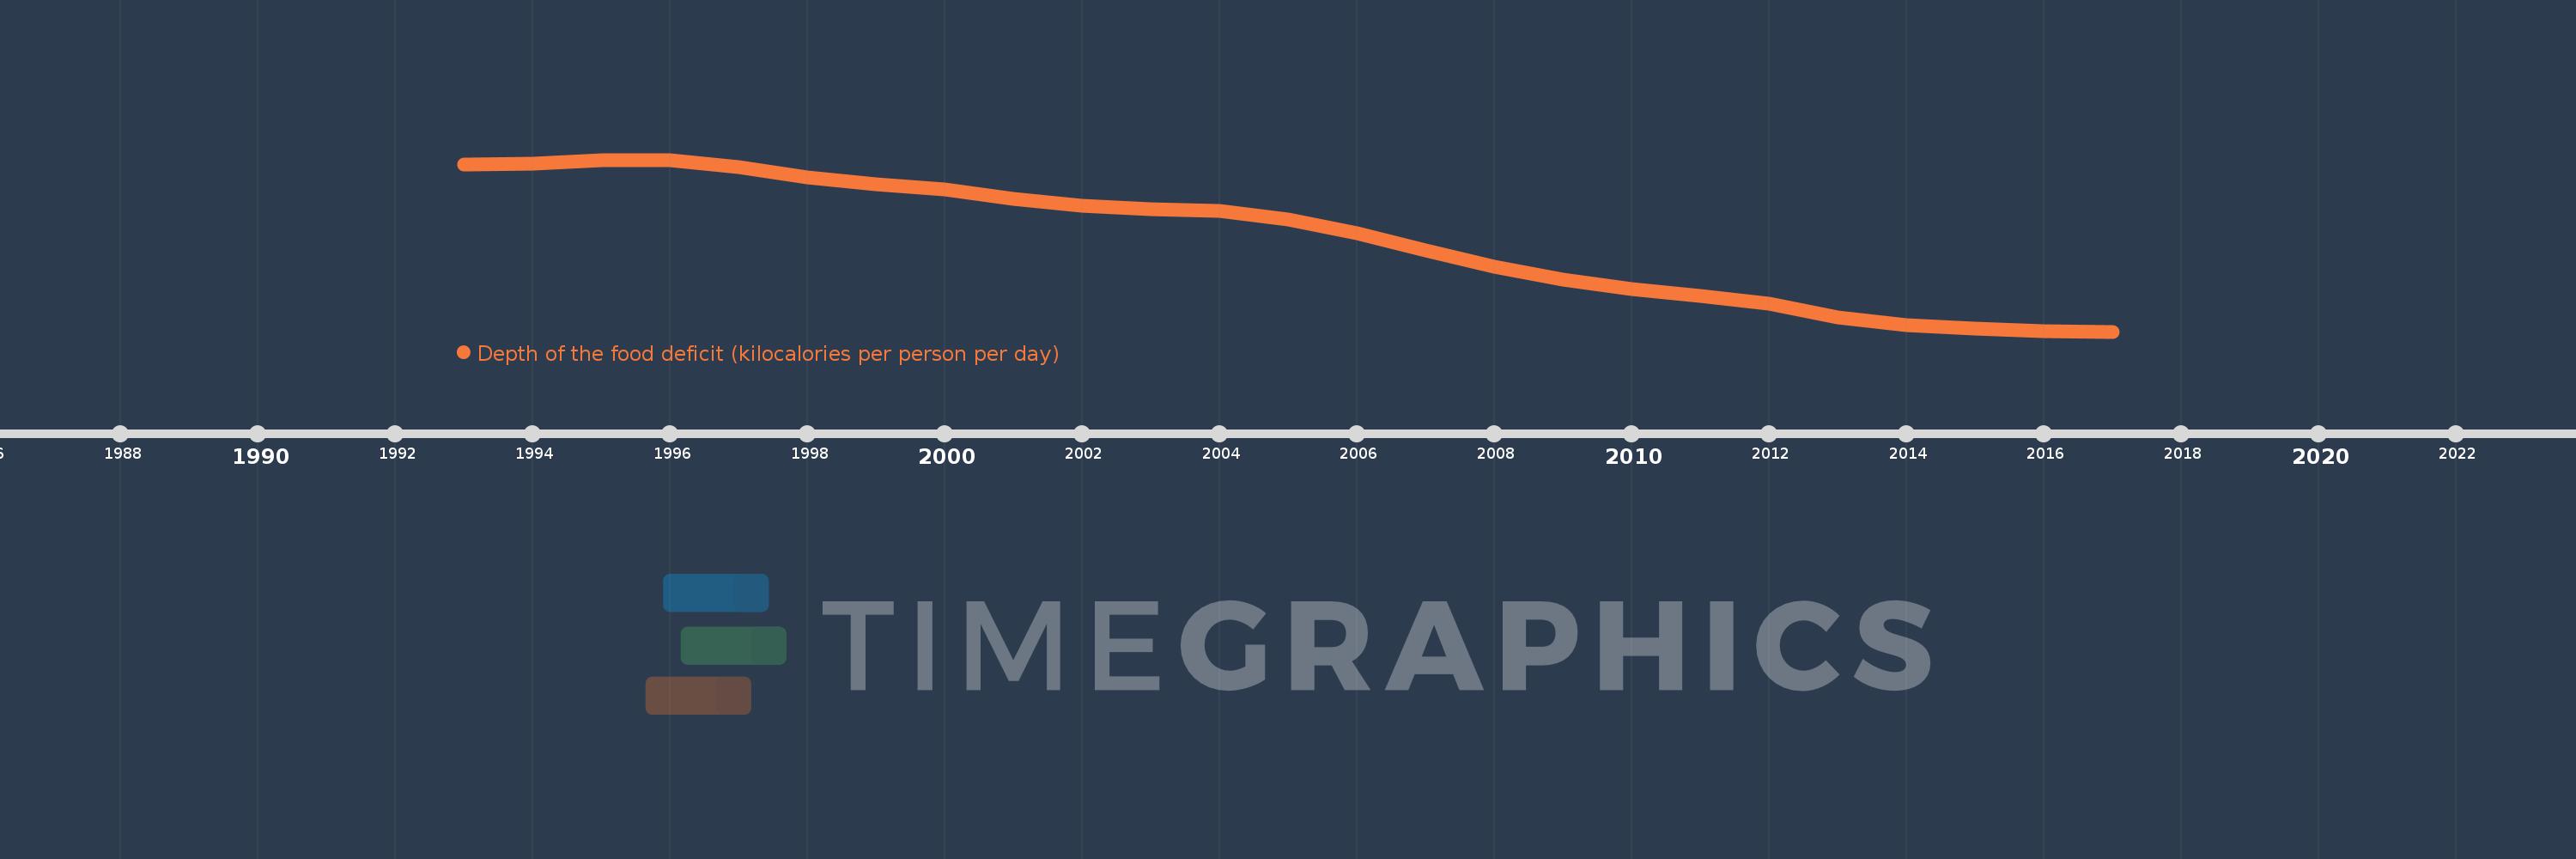
Depth of the food deficit (kilocalories per person per day)
2017,2016,2015,2014,2013,2012,2011,2010,2009,2008,2007,2006,2005,2004,2003,2002,2001,2000,1999,1998,1997,1996,1995,1994,1993
This statistics in other country:
Timeline:
This timeline shows a graph from 1993 to 2017 of Pre-demographic dividend. No data until 1992. Number of actual observations by date: 25.
Source name:
World Development Indicators
Source organization:
Food and Agriculture Organization, Food Security Statistics.
Categories, topics:
Health
Last updated:
apr 23, 2017
Indicators value changes by year
Minimum:
127.98
jan 1, 2017
Maximum:
201.088
jan 1, 1995
At the date of observation
Value
Absolute change
Change from previous value
jan 1, 1993
199.086
+199.086
0.0%
jan 1, 1994
199.474
+0.388
0.19%
jan 1, 1995
201.088
+1.614
0.81%
jan 1, 1996
201.022
-0.066
-0.03%
jan 1, 1997
197.817
-3.205
-1.59%
jan 1, 1998
193.654
-4.163
-2.1%
jan 1, 1999
190.643
-3.011
-1.55%
jan 1, 2000
188.384
-2.259
-1.18%
jan 1, 2001
184.464
-3.92
-2.08%
jan 1, 2002
181.581
-2.884
-1.56%
jan 1, 2003
180.044
-1.537
-0.85%
jan 1, 2004
179.379
-0.664
-0.37%
jan 1, 2005
175.785
-3.595
-2.0%
jan 1, 2006
169.988
-5.797
-3.3%
jan 1, 2007
162.529
-7.459
-4.39%
jan 1, 2008
155.635
-6.895
-4.24%
jan 1, 2009
150.067
-5.567
-3.58%
jan 1, 2010
146.222
-3.845
-2.56%
jan 1, 2011
143.272
-2.95
-2.02%
jan 1, 2012
140.002
-3.27
-2.28%
jan 1, 2013
134.171
-5.831
-4.16%
jan 1, 2014
130.79
-3.382
-2.52%
jan 1, 2015
129.077
-1.713
-1.31%
jan 1, 2016
128.185
-0.892
-0.69%
jan 1, 2017
127.98
-0.205
-0.16%
Ranking of countries by current statistics by years


Comments: