29
/
en
AIzaSyAYiBZKx7MnpbEhh9jyipgxe19OcubqV5w
April 1, 2024
61499
Upper middle income
UMC
false
2
1
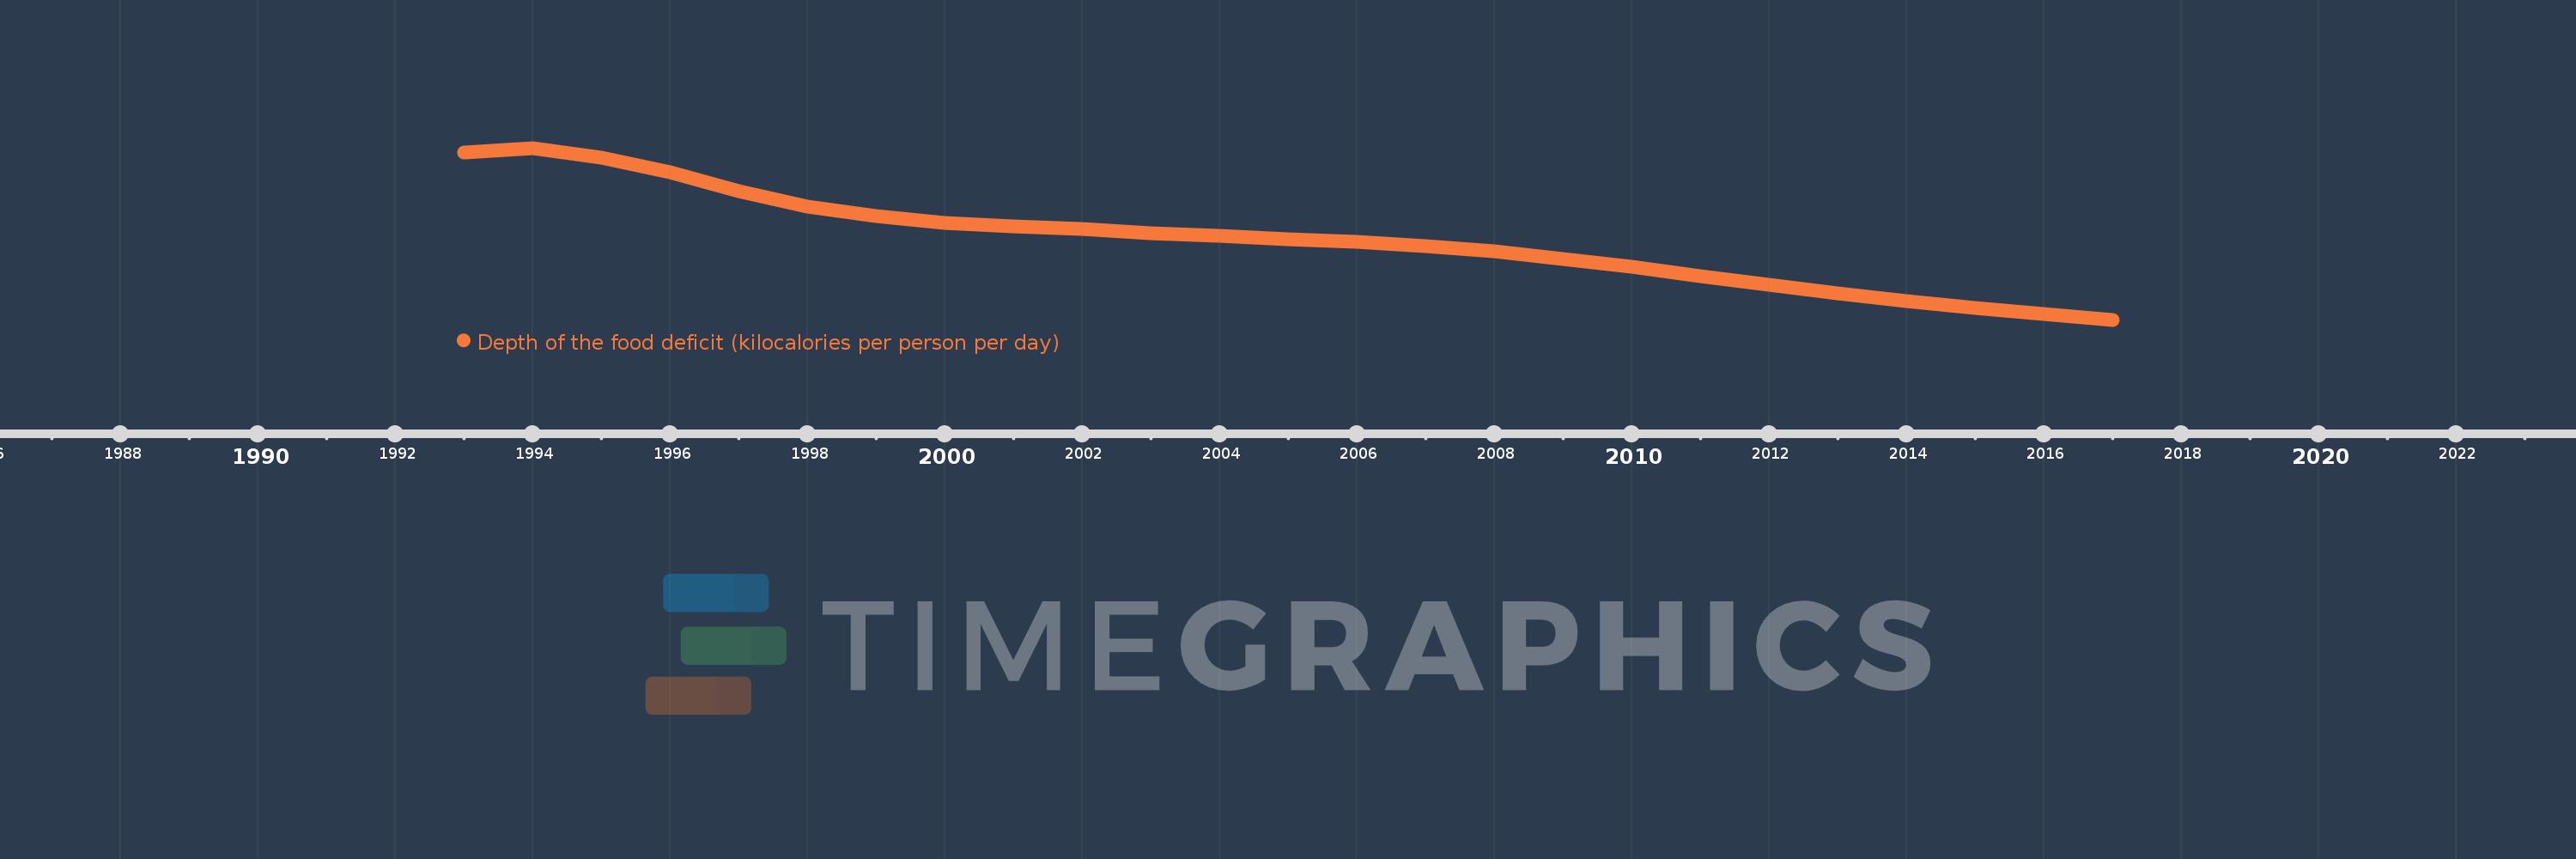
Depth of the food deficit (kilocalories per person per day)
2017,2016,2015,2014,2013,2012,2011,2010,2009,2008,2007,2006,2005,2004,2003,2002,2001,2000,1999,1998,1997,1996,1995,1994,1993
This statistics in other country:
Timeline:
This timeline shows a graph from 1993 to 2017 of Upper middle income. No data until 1992. Number of actual observations by date: 25.
Source name:
World Development Indicators
Source organization:
Food and Agriculture Organization, Food Security Statistics.
Categories, topics:
Health
Last updated:
apr 23, 2017
Indicators value changes by year
Minimum:
56.421
jan 1, 2017
Maximum:
155.36
jan 1, 1994
At the date of observation
Value
Absolute change
Change from previous value
jan 1, 1993
152.571
+152.571
0.0%
jan 1, 1994
155.36
+2.789
1.83%
jan 1, 1995
149.87
-5.49
-3.53%
jan 1, 1996
141.125
-8.745
-5.84%
jan 1, 1997
130.334
-10.791
-7.65%
jan 1, 1998
121.648
-8.686
-6.66%
jan 1, 1999
116.115
-5.532
-4.55%
jan 1, 2000
112.409
-3.707
-3.19%
jan 1, 2001
110.274
-2.135
-1.9%
jan 1, 2002
108.481
-1.793
-1.63%
jan 1, 2003
106.242
-2.239
-2.06%
jan 1, 2004
104.635
-1.607
-1.51%
jan 1, 2005
103.011
-1.625
-1.55%
jan 1, 2006
101.167
-1.844
-1.79%
jan 1, 2007
98.734
-2.432
-2.4%
jan 1, 2008
95.785
-2.95
-2.99%
jan 1, 2009
91.225
-4.56
-4.76%
jan 1, 2010
87.098
-4.126
-4.52%
jan 1, 2011
81.38
-5.719
-6.57%
jan 1, 2012
76.462
-4.917
-6.04%
jan 1, 2013
71.461
-5.002
-6.54%
jan 1, 2014
67.135
-4.325
-6.05%
jan 1, 2015
63.351
-3.784
-5.64%
jan 1, 2016
59.623
-3.728
-5.89%
jan 1, 2017
56.421
-3.202
-5.37%
Ranking of countries by current statistics by years


Comments: