29
/
en
AIzaSyAYiBZKx7MnpbEhh9jyipgxe19OcubqV5w
April 1, 2024
204020
Myanmar
MMR
true
2
1
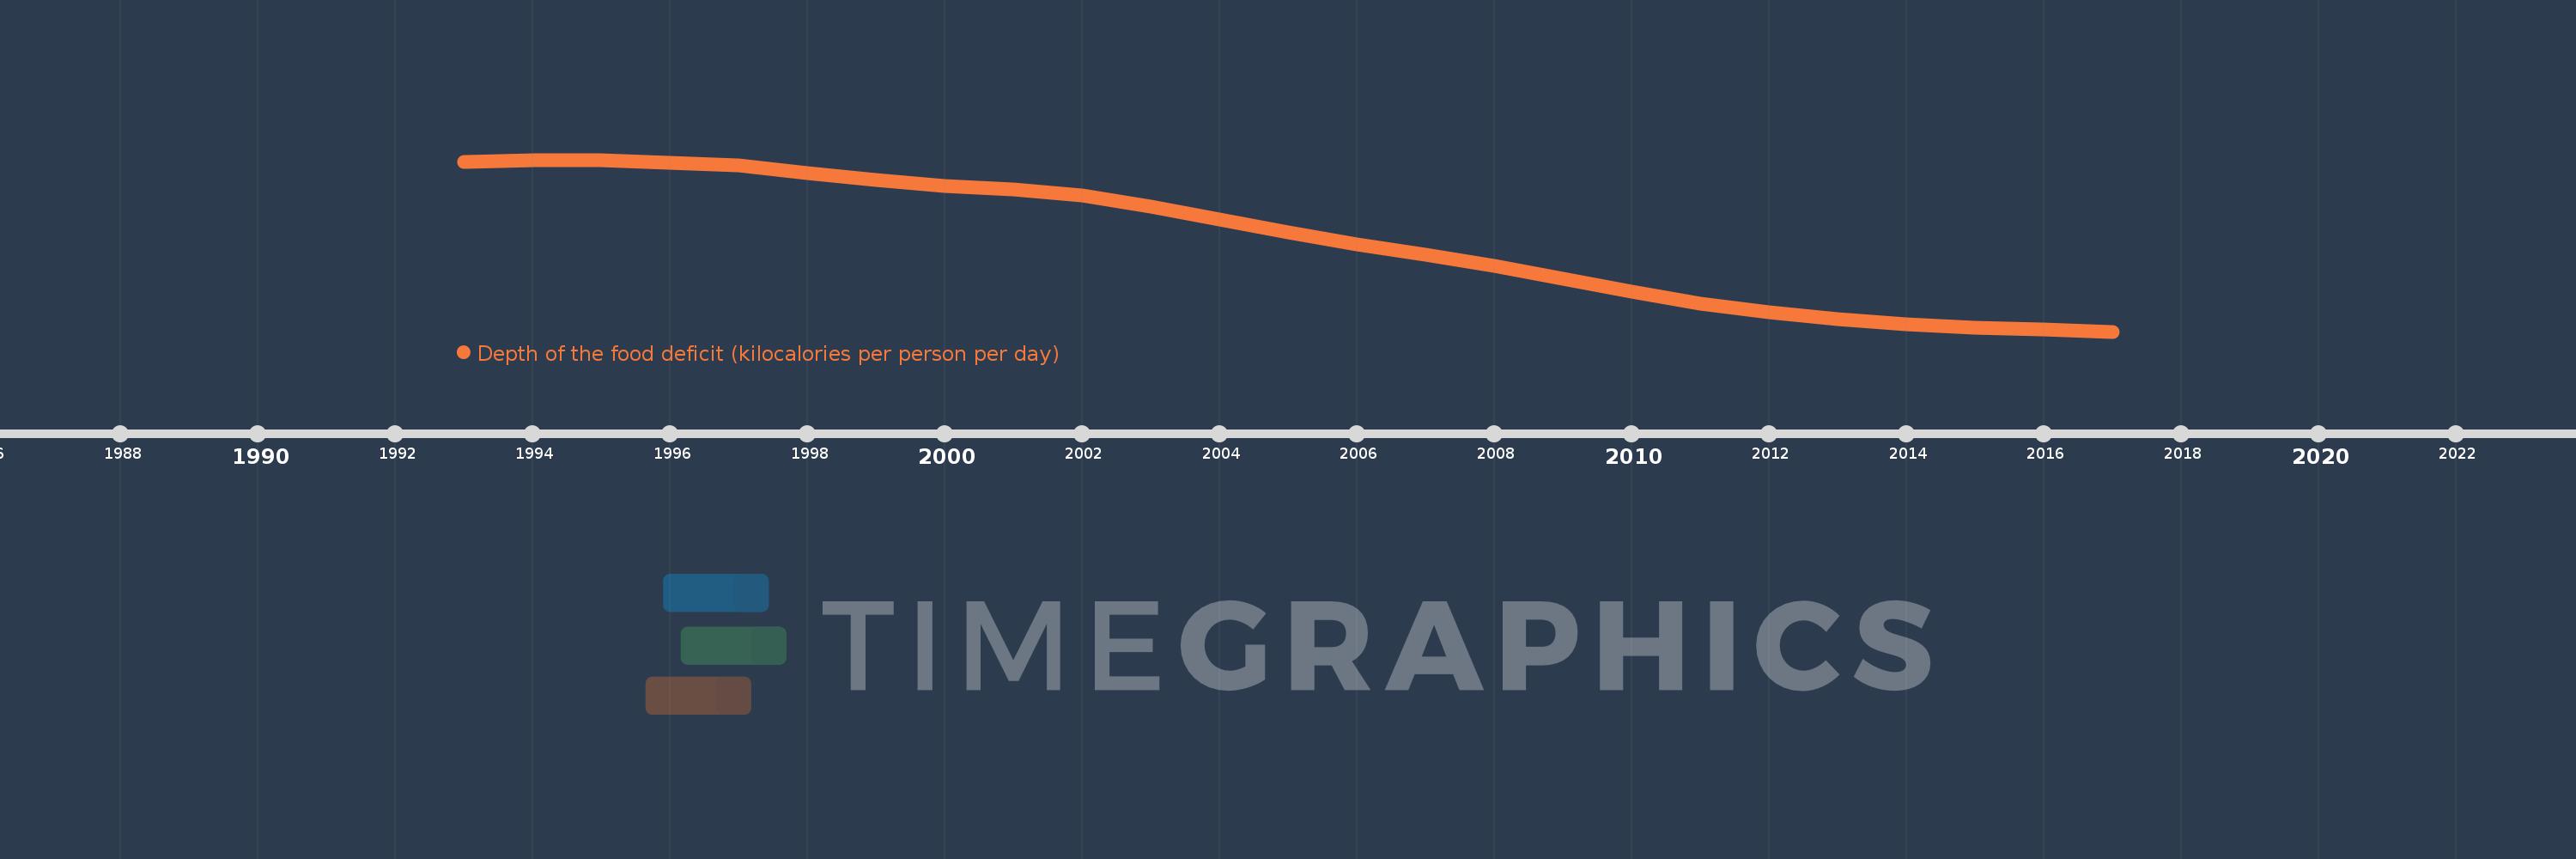
Depth of the food deficit (kilocalories per person per day)
2017,2016,2015,2014,2013,2012,2011,2010,2009,2008,2007,2006,2005,2004,2003,2002,2001,2000,1999,1998,1997,1996,1995,1994,1993
This statistics in other country:
Timeline:
This timeline shows a graph from 1993 to 2017 of Myanmar. No data until 1992. Number of actual observations by date: 25.
Source name:
World Development Indicators
Source organization:
Food and Agriculture Organization, Food Security Statistics.
Categories, topics:
Health
Last updated:
apr 23, 2017
Indicators value changes by year
At the date of observation
Value
Absolute change
Change from previous value
jan 1, 1993
511.0
+511.0
0.0%
jan 1, 1994
515.0
+4.0
0.78%
jan 1, 1995
516.0
+1.0
0.19%
jan 1, 1996
509.0
-7.0
-1.36%
jan 1, 1997
502.0
-7.0
-1.38%
jan 1, 1998
485.0
-17.0
-3.39%
jan 1, 1999
468.0
-17.0
-3.51%
jan 1, 2000
453.0
-15.0
-3.21%
jan 1, 2001
444.0
-9.0
-1.99%
jan 1, 2002
430.0
-14.0
-3.15%
jan 1, 2003
404.0
-26.0
-6.05%
jan 1, 2004
372.0
-32.0
-7.92%
jan 1, 2005
341.0
-31.0
-8.33%
jan 1, 2006
313.0
-28.0
-8.21%
jan 1, 2007
287.0
-26.0
-8.31%
jan 1, 2008
260.0
-27.0
-9.41%
jan 1, 2009
229.0
-31.0
-11.92%
jan 1, 2010
199.0
-30.0
-13.1%
jan 1, 2011
171.0
-28.0
-14.07%
jan 1, 2012
149.0
-22.0
-12.87%
jan 1, 2013
132.0
-17.0
-11.41%
jan 1, 2014
120.0
-12.0
-9.09%
jan 1, 2015
113.0
-7.0
-5.83%
jan 1, 2016
108.0
-5.0
-4.42%
jan 1, 2017
103.0
-5.0
-4.63%
Ranking of countries by current statistics by years


Comments: