29
/it/
it
AIzaSyAYiBZKx7MnpbEhh9jyipgxe19OcubqV5w
April 1, 2024
282130
Vietnam
VNM
true
2
1
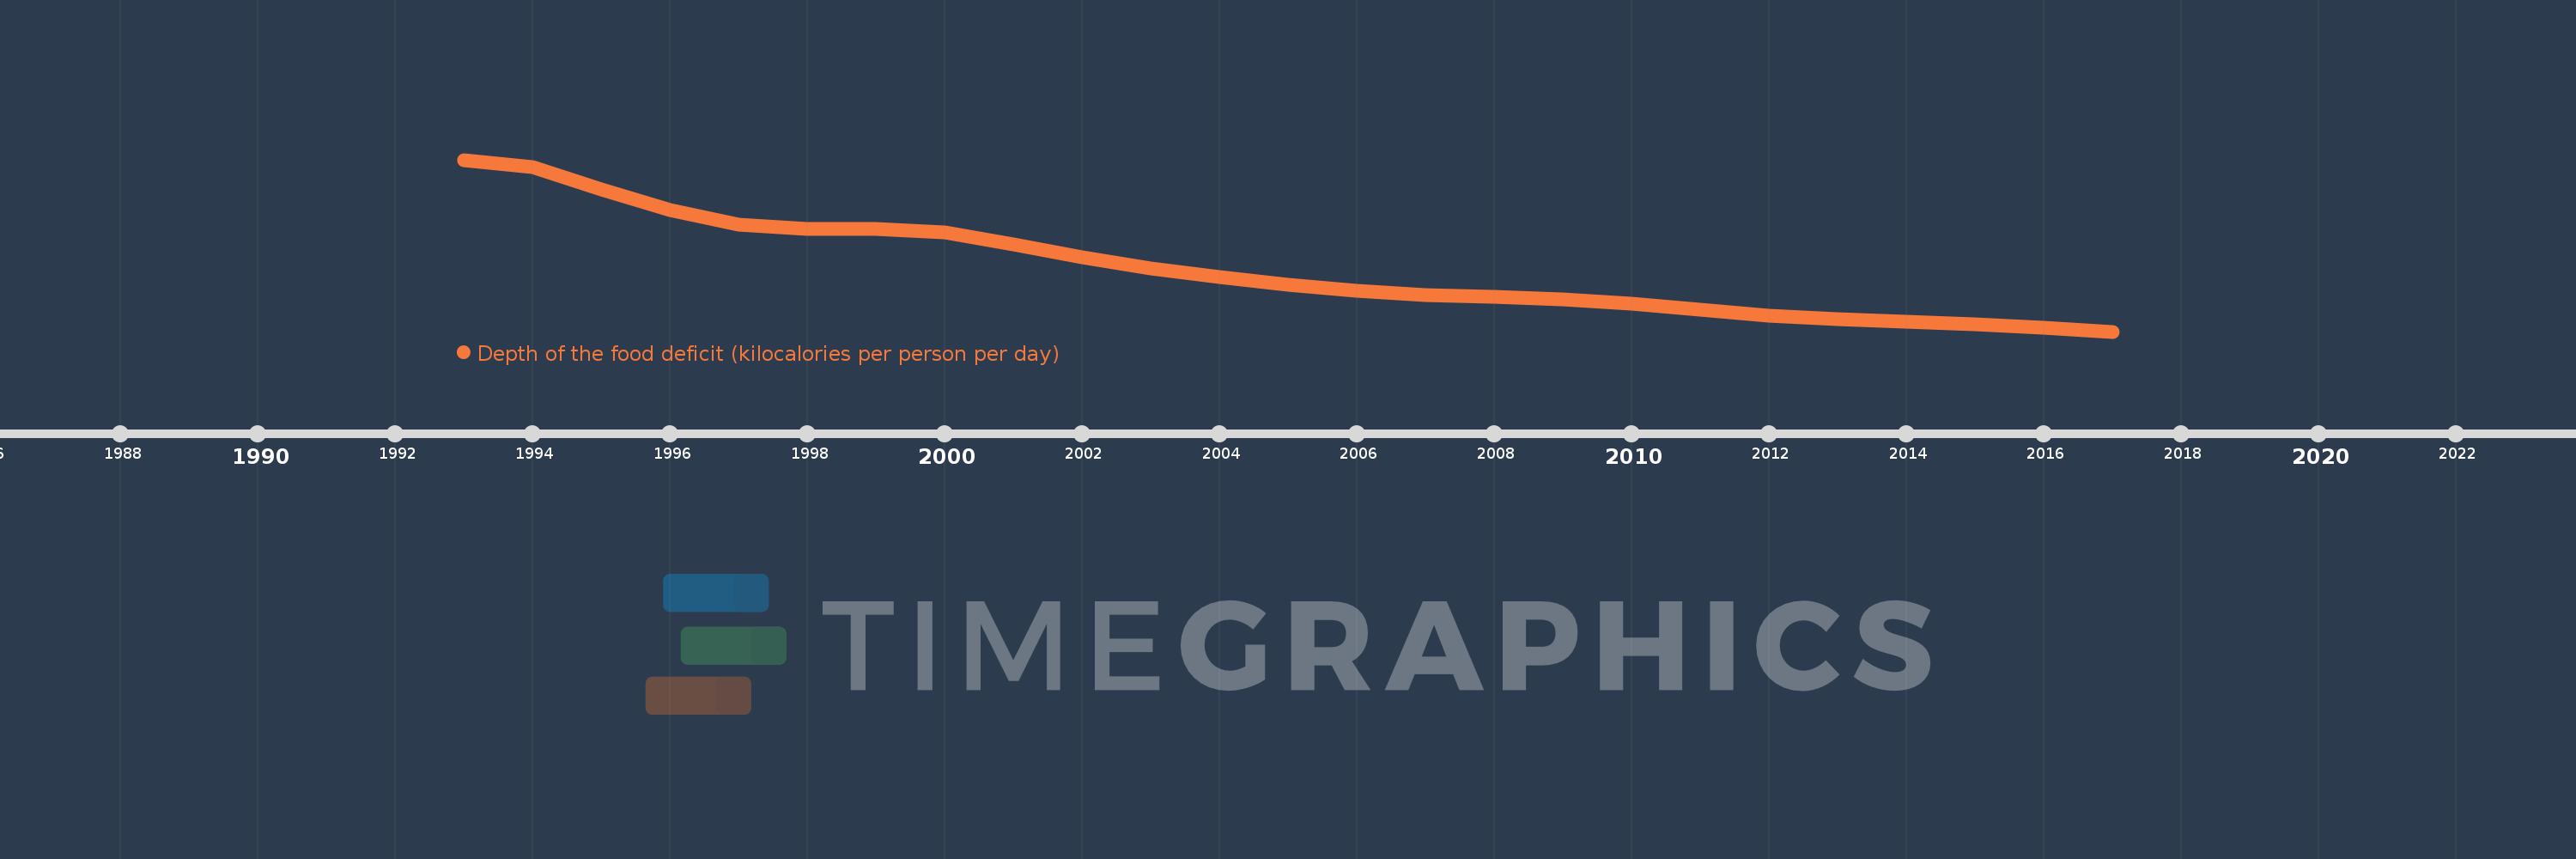
Depth of the food deficit (kilocalories per person per day)
2017,2016,2015,2014,2013,2012,2011,2010,2009,2008,2007,2006,2005,2004,2003,2002,2001,2000,1999,1998,1997,1996,1995,1994,1993
Queste statistiche in altri paesi:
Linea del tempo:
Questa scala temporale mostra un grafico dal 1993 anno al 2017 anno. Vietnam. I dati fino ad 1992 anno non disponibili. Il numero di osservazioni attuali secondo i date: 25.
La fonte (nome):
Indicatori dello sviluppo mondiale
La fonte (organizzazione):
Food and Agriculture Organization, Food Security Statistics.
Categorie:
Health
sono stati aggiornati
23 apr 2017 anni
Indicatori delle variazioni dei valori per anni
Minima:
83.0
1 gen 2017 anni
Massimo:
368.0
1 gen 1993 anni
Alla data di osservazione
Valore
Variazione assoluta
La variazione rispetto al valore precedente
1 gen 1993 anni
368.0
+368.0
0.0%
1 gen 1994 anni
356.0
-12.0
-3.26%
1 gen 1995 anni
319.0
-37.0
-10.39%
1 gen 1996 anni
285.0
-34.0
-10.66%
1 gen 1997 anni
261.0
-24.0
-8.42%
1 gen 1998 anni
254.0
-7.0
-2.68%
1 gen 1999 anni
254.0
0.0
0.0%
1 gen 2000 anni
247.0
-7.0
-2.76%
1 gen 2001 anni
228.0
-19.0
-7.69%
1 gen 2002 anni
206.0
-22.0
-9.65%
1 gen 2003 anni
188.0
-18.0
-8.74%
1 gen 2004 anni
173.0
-15.0
-7.98%
1 gen 2005 anni
160.0
-13.0
-7.51%
1 gen 2006 anni
150.0
-10.0
-6.25%
1 gen 2007 anni
144.0
-6.0
-4.0%
1 gen 2008 anni
141.0
-3.0
-2.08%
1 gen 2009 anni
137.0
-4.0
-2.84%
1 gen 2010 anni
129.0
-8.0
-5.84%
1 gen 2011 anni
119.0
-10.0
-7.75%
1 gen 2012 anni
110.0
-9.0
-7.56%
1 gen 2013 anni
103.0
-7.0
-6.36%
1 gen 2014 anni
99.0
-4.0
-3.88%
1 gen 2015 anni
95.0
-4.0
-4.04%
1 gen 2016 anni
89.0
-6.0
-6.32%
1 gen 2017 anni
83.0
-6.0
-6.74%
Classificazione dei paesi secondo i statistiche attuali per anni


Commenti: