29
/it/
it
AIzaSyAYiBZKx7MnpbEhh9jyipgxe19OcubqV5w
April 1, 2024
205116
Namibia
NAM
true
2
1
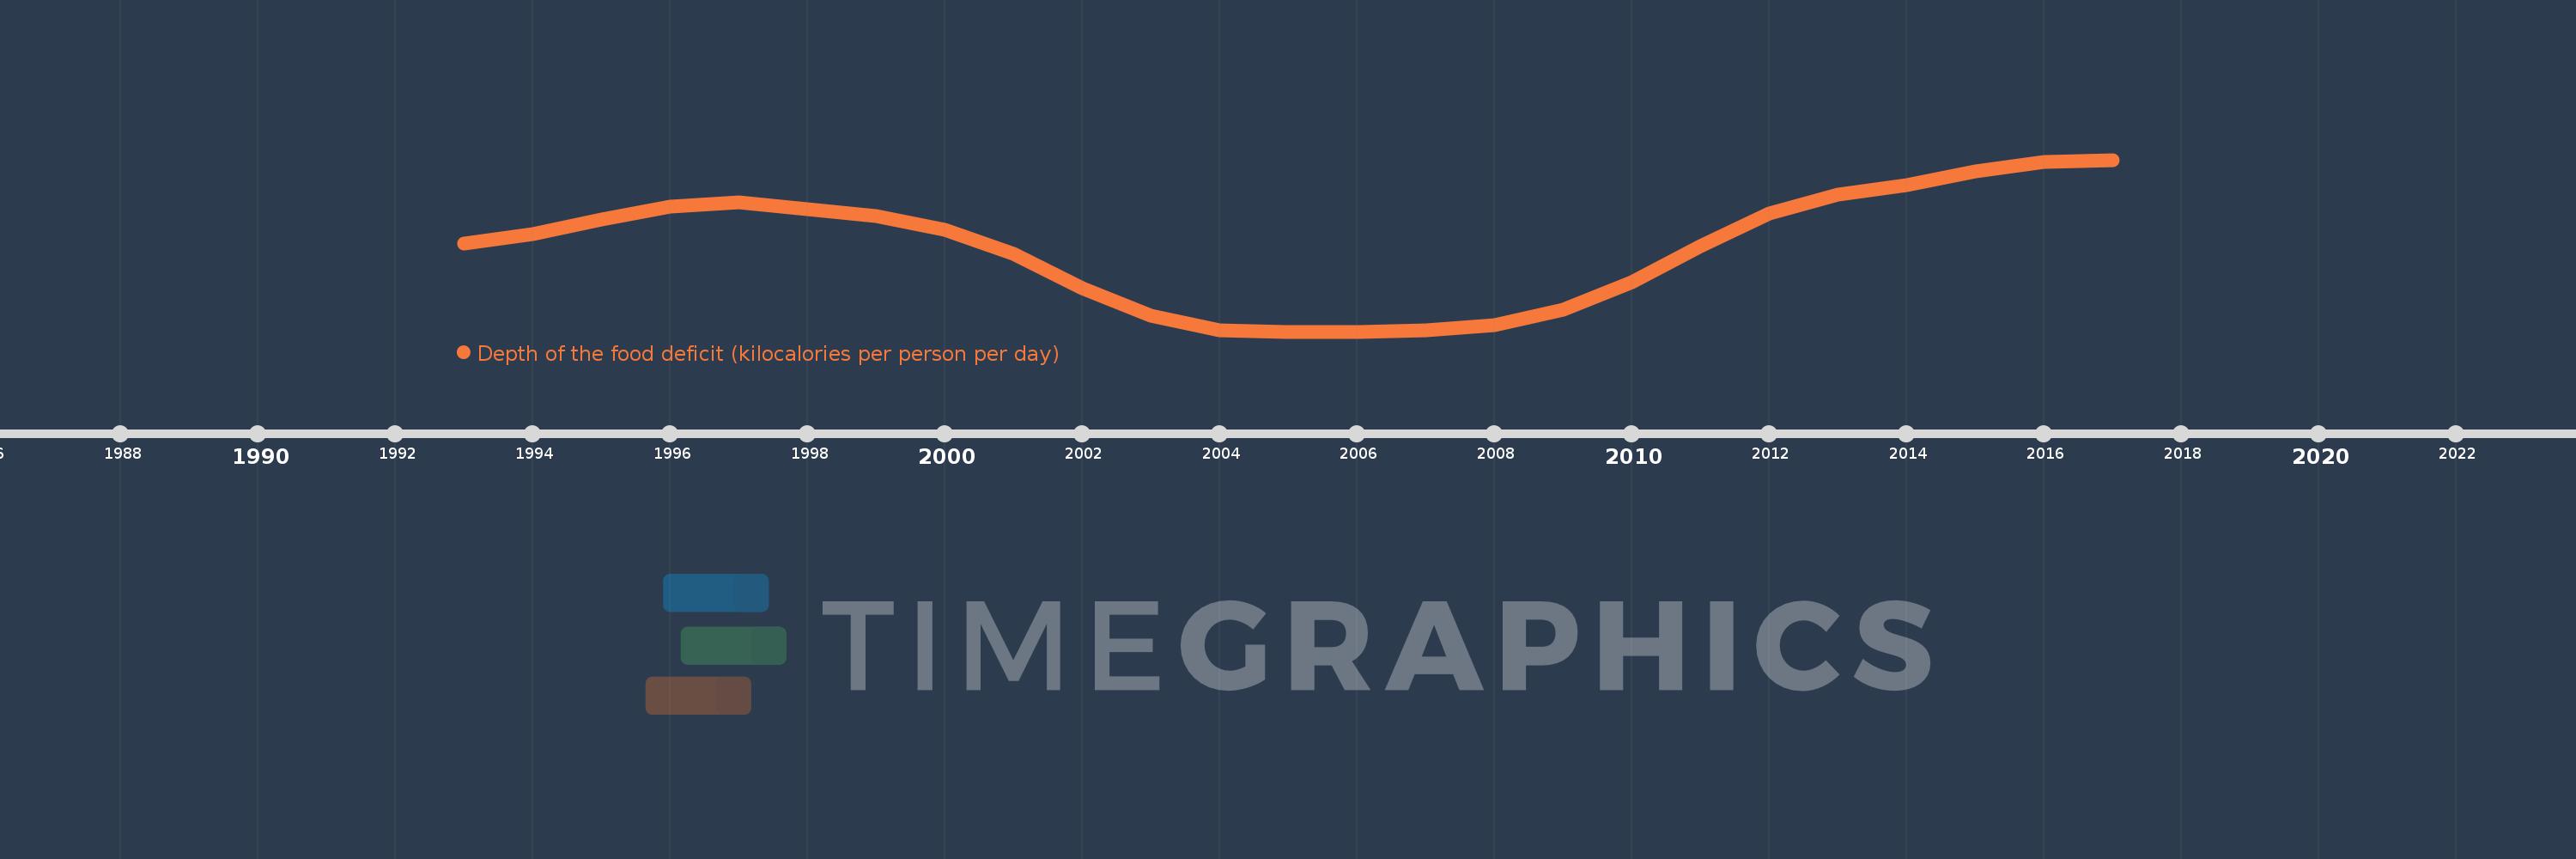
Depth of the food deficit (kilocalories per person per day)
2017,2016,2015,2014,2013,2012,2011,2010,2009,2008,2007,2006,2005,2004,2003,2002,2001,2000,1999,1998,1997,1996,1995,1994,1993
Queste statistiche in altri paesi:
Linea del tempo:
Questa scala temporale mostra un grafico dal 1993 anno al 2017 anno. Namibia. I dati fino ad 1992 anno non disponibili. Il numero di osservazioni attuali secondo i date: 25.
La fonte (nome):
Indicatori dello sviluppo mondiale
La fonte (organizzazione):
Food and Agriculture Organization, Food Security Statistics.
Categorie:
Health
sono stati aggiornati
23 apr 2017 anni
Indicatori delle variazioni dei valori per anni
Minima:
175.0
1 gen 2005 anni
Massimo:
325.0
1 gen 2017 anni
Alla data di osservazione
Valore
Variazione assoluta
La variazione rispetto al valore precedente
1 gen 1993 anni
252.0
+252.0
0.0%
1 gen 1994 anni
260.0
+8.0
3.17%
1 gen 1995 anni
273.0
+13.0
5.0%
1 gen 1996 anni
284.0
+11.0
4.03%
1 gen 1997 anni
288.0
+4.0
1.41%
1 gen 1998 anni
282.0
-6.0
-2.08%
1 gen 1999 anni
276.0
-6.0
-2.13%
1 gen 2000 anni
264.0
-12.0
-4.35%
1 gen 2001 anni
243.0
-21.0
-7.95%
1 gen 2002 anni
213.0
-30.0
-12.35%
1 gen 2003 anni
189.0
-24.0
-11.27%
1 gen 2004 anni
176.0
-13.0
-6.88%
1 gen 2005 anni
175.0
-1.0
-0.57%
1 gen 2006 anni
175.0
0.0
0.0%
1 gen 2007 anni
176.0
+1.0
0.57%
1 gen 2008 anni
181.0
+5.0
2.84%
1 gen 2009 anni
194.0
+13.0
7.18%
1 gen 2010 anni
218.0
+24.0
12.37%
1 gen 2011 anni
250.0
+32.0
14.68%
1 gen 2012 anni
278.0
+28.0
11.2%
1 gen 2013 anni
295.0
+17.0
6.12%
1 gen 2014 anni
303.0
+8.0
2.71%
1 gen 2015 anni
315.0
+12.0
3.96%
1 gen 2016 anni
323.0
+8.0
2.54%
1 gen 2017 anni
325.0
+2.0
0.62%
Classificazione dei paesi secondo i statistiche attuali per anni


Commenti: