29
/es/
es
AIzaSyAYiBZKx7MnpbEhh9jyipgxe19OcubqV5w
April 1, 2024
205116
Namibia
NAM
true
2
1
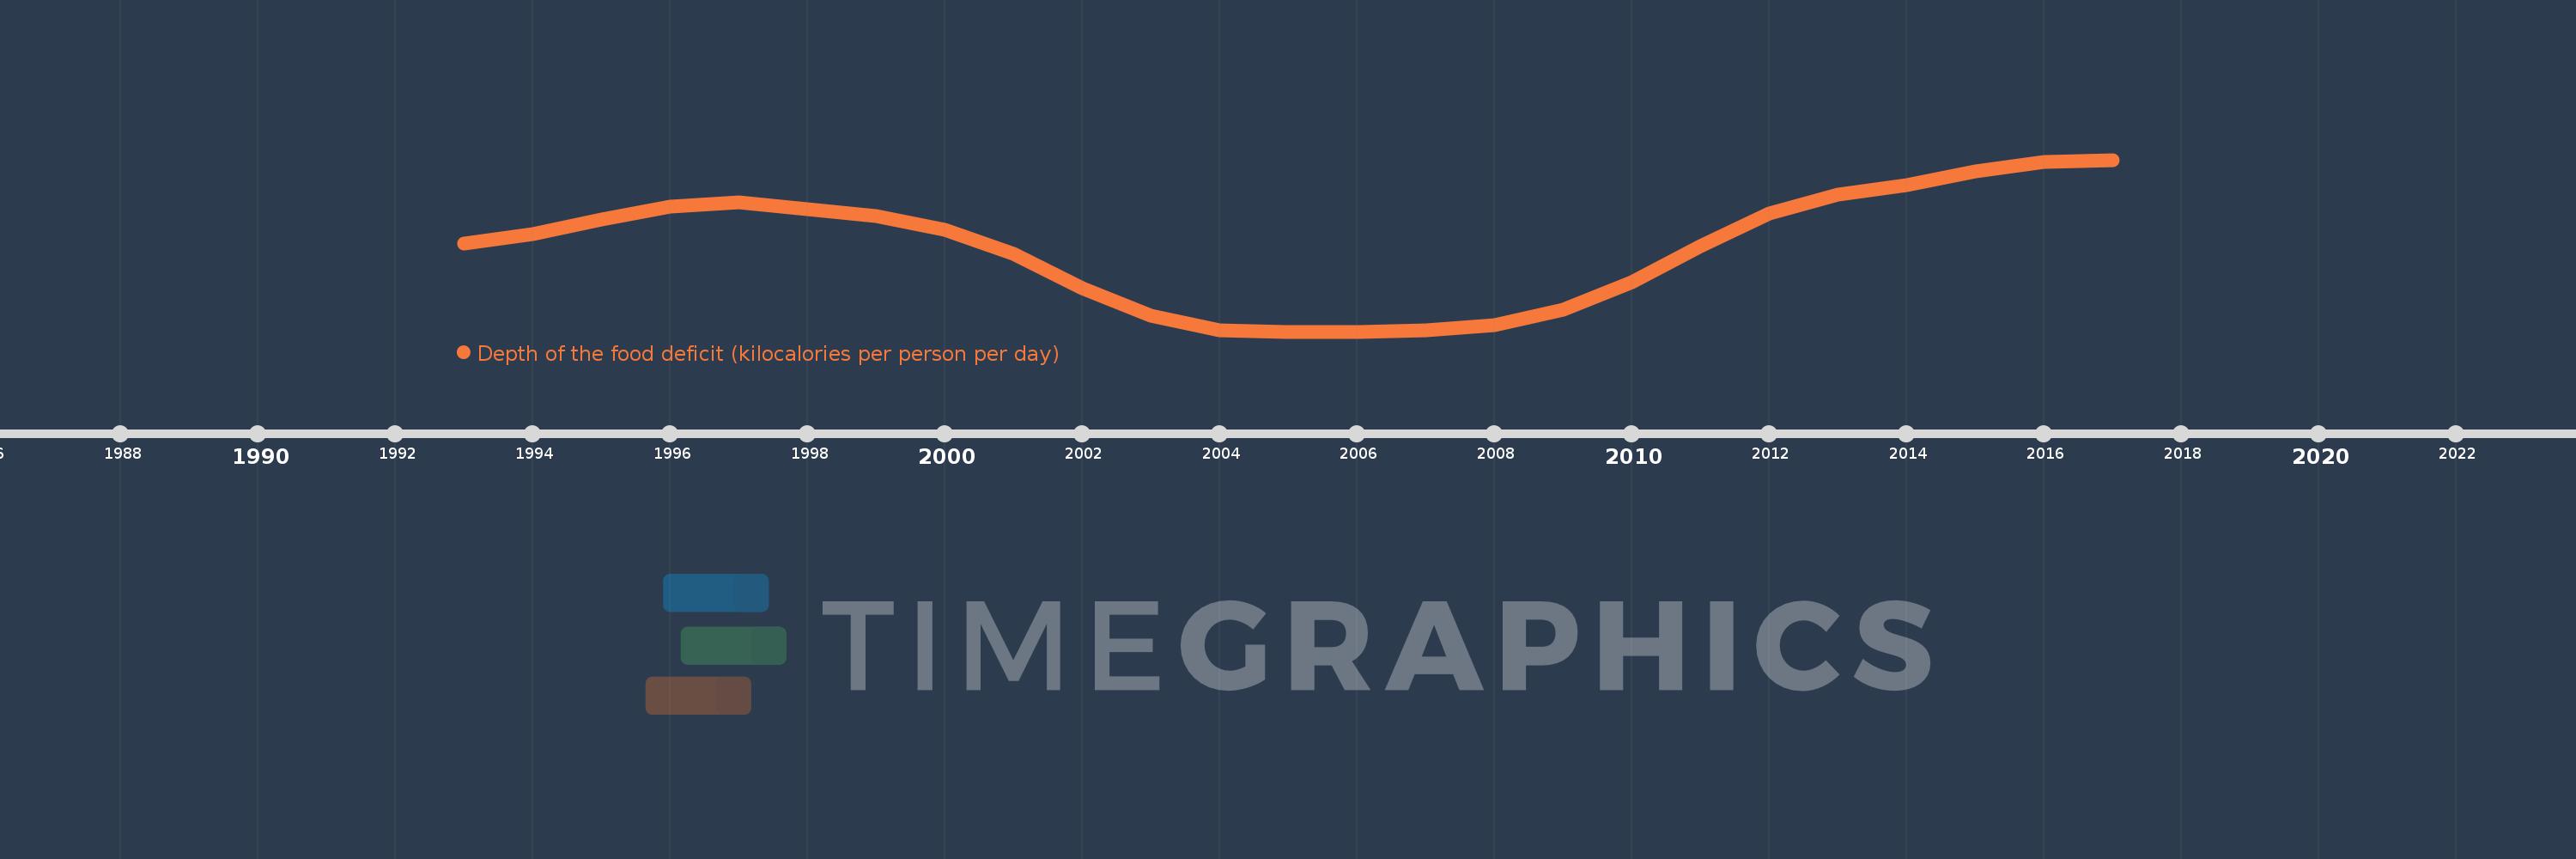
Depth of the food deficit (kilocalories per person per day)
2017,2016,2015,2014,2013,2012,2011,2010,2009,2008,2007,2006,2005,2004,2003,2002,2001,2000,1999,1998,1997,1996,1995,1994,1993
Estas estadísticas en otros países:
línea de tiempo (timeline):
En esta escala de tiempo se presenta un gráfico de 1993 y 2017 de Namibia. Los datos de 1992 están ausentes. El número de observaciones reales por fecha: 25.
Fuente (nombre):
Indicadores del desarrollo mundial
Fuente (organización):
Food and Agriculture Organization, Food Security Statistics.
Categorías:
Health
Se ha actualizado:
23 abr 2017 año
Los indicadores de los cambios de valor en los últimos años
Mínimo:
175.0
1 ene 2005 año
Máximo:
325.0
1 ene 2017 año
A la fecha de observación
Valor
Cambio absoluto
El cambio con respecto al valor anterior
1 ene 1993 año
252.0
+252.0
0.0%
1 ene 1994 año
260.0
+8.0
3.17%
1 ene 1995 año
273.0
+13.0
5.0%
1 ene 1996 año
284.0
+11.0
4.03%
1 ene 1997 año
288.0
+4.0
1.41%
1 ene 1998 año
282.0
-6.0
-2.08%
1 ene 1999 año
276.0
-6.0
-2.13%
1 ene 2000 año
264.0
-12.0
-4.35%
1 ene 2001 año
243.0
-21.0
-7.95%
1 ene 2002 año
213.0
-30.0
-12.35%
1 ene 2003 año
189.0
-24.0
-11.27%
1 ene 2004 año
176.0
-13.0
-6.88%
1 ene 2005 año
175.0
-1.0
-0.57%
1 ene 2006 año
175.0
0.0
0.0%
1 ene 2007 año
176.0
+1.0
0.57%
1 ene 2008 año
181.0
+5.0
2.84%
1 ene 2009 año
194.0
+13.0
7.18%
1 ene 2010 año
218.0
+24.0
12.37%
1 ene 2011 año
250.0
+32.0
14.68%
1 ene 2012 año
278.0
+28.0
11.2%
1 ene 2013 año
295.0
+17.0
6.12%
1 ene 2014 año
303.0
+8.0
2.71%
1 ene 2015 año
315.0
+12.0
3.96%
1 ene 2016 año
323.0
+8.0
2.54%
1 ene 2017 año
325.0
+2.0
0.62%
Ranking de los países por los datos estadísticos actuales


Comentarios: