29
/es/
es
AIzaSyAYiBZKx7MnpbEhh9jyipgxe19OcubqV5w
April 1, 2024
36472
IBRD only
IBD
false
2
1
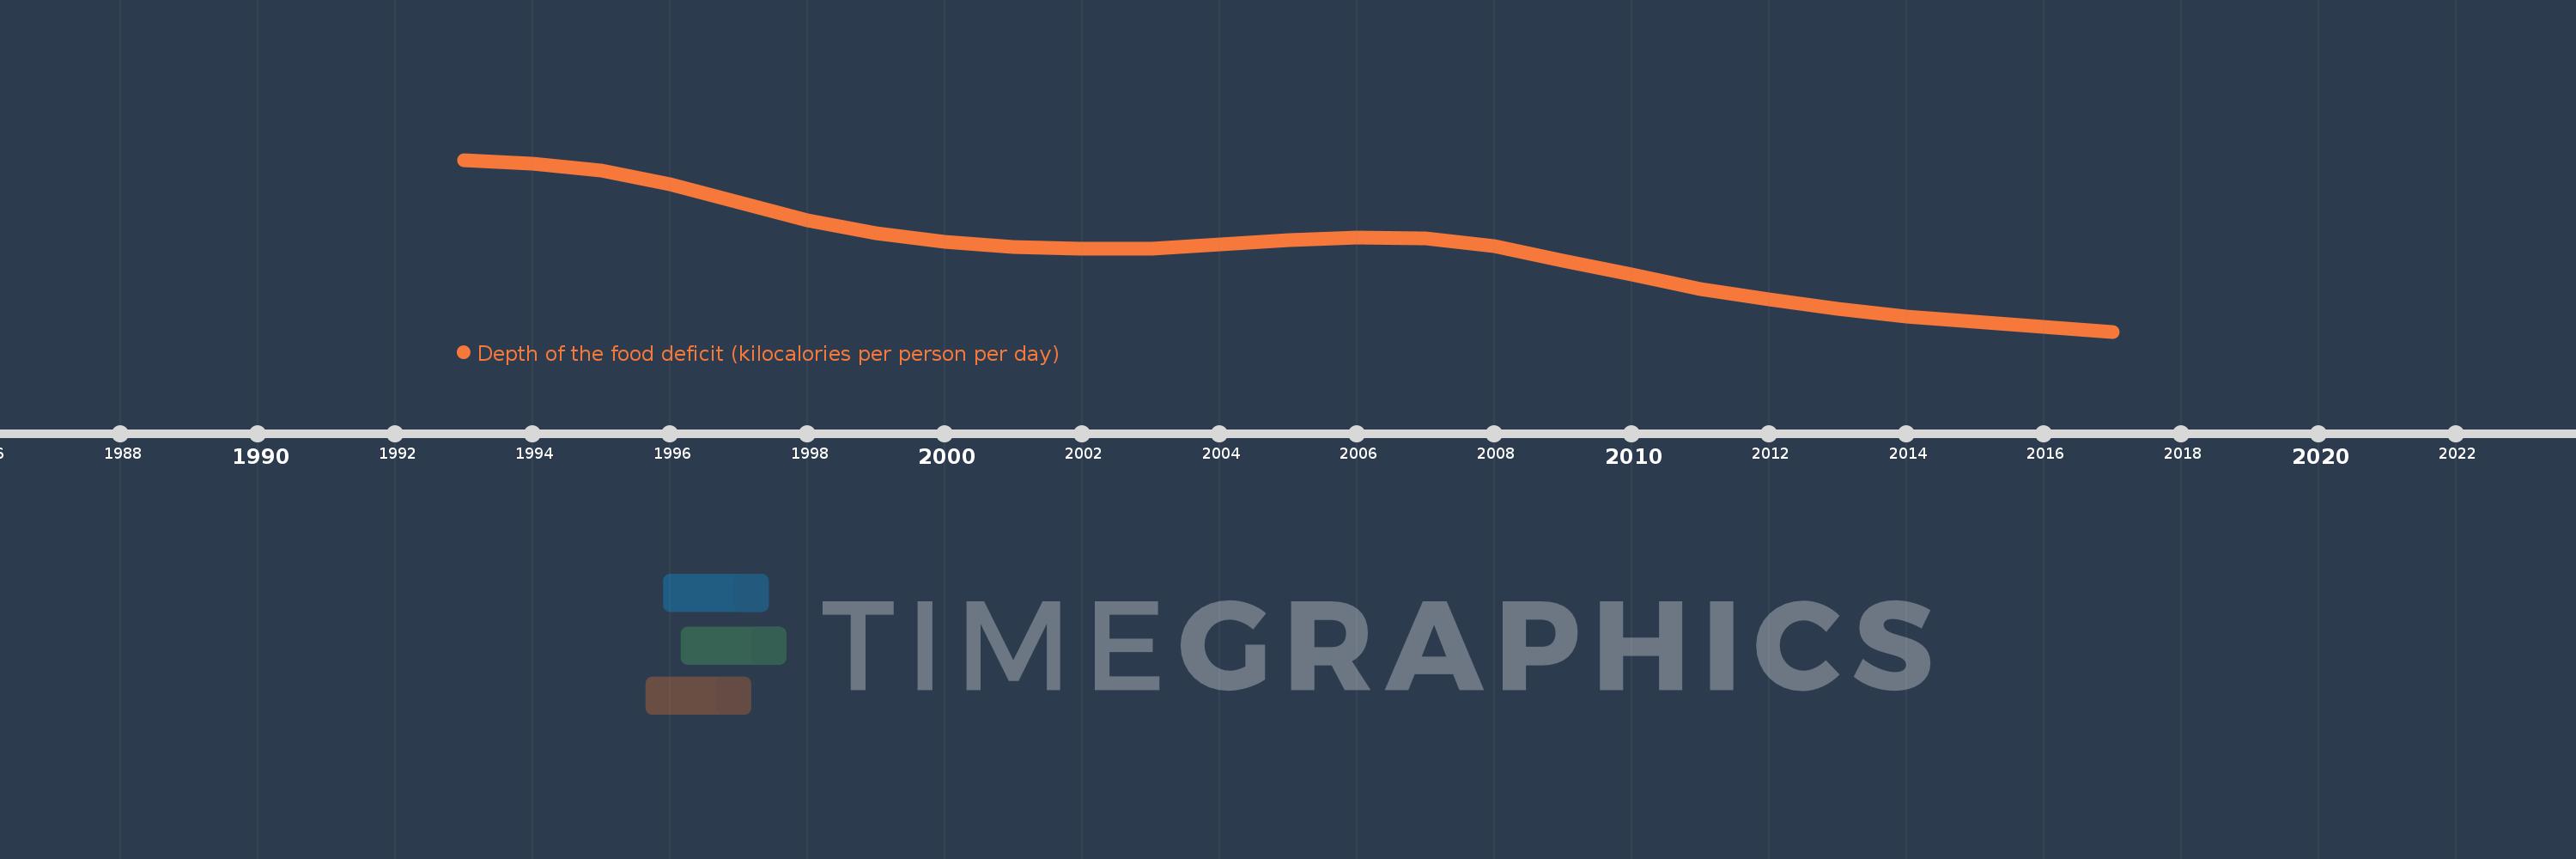
Depth of the food deficit (kilocalories per person per day)
2017,2016,2015,2014,2013,2012,2011,2010,2009,2008,2007,2006,2005,2004,2003,2002,2001,2000,1999,1998,1997,1996,1995,1994,1993
Estas estadísticas en otros países:
línea de tiempo (timeline):
En esta escala de tiempo se presenta un gráfico de 1993 y 2017 de IBRD only. Los datos de 1992 están ausentes. El número de observaciones reales por fecha: 25.
Fuente (nombre):
Indicadores del desarrollo mundial
Fuente (organización):
Food and Agriculture Organization, Food Security Statistics.
Categorías:
Health
Se ha actualizado:
23 abr 2017 año
Los indicadores de los cambios de valor en los últimos años
Mínimo:
72.165
1 ene 2017 año
Máximo:
151.721
1 ene 1993 año
A la fecha de observación
Valor
Cambio absoluto
El cambio con respecto al valor anterior
1 ene 1993 año
151.721
+151.721
0.0%
1 ene 1994 año
149.969
-1.752
-1.15%
1 ene 1995 año
146.758
-3.211
-2.14%
1 ene 1996 año
140.263
-6.495
-4.43%
1 ene 1997 año
132.131
-8.132
-5.8%
1 ene 1998 año
123.848
-8.283
-6.27%
1 ene 1999 año
117.851
-5.997
-4.84%
1 ene 2000 año
113.817
-4.035
-3.42%
1 ene 2001 año
111.531
-2.285
-2.01%
1 ene 2002 año
110.356
-1.175
-1.05%
1 ene 2003 año
110.461
+0.105
0.1%
1 ene 2004 año
112.445
+1.984
1.8%
1 ene 2005 año
114.464
+2.019
1.8%
1 ene 2006 año
115.762
+1.298
1.13%
1 ene 2007 año
115.212
-0.549
-0.47%
1 ene 2008 año
111.556
-3.656
-3.17%
1 ene 2009 año
105.054
-6.502
-5.83%
1 ene 2010 año
98.467
-6.587
-6.27%
1 ene 2011 año
91.925
-6.542
-6.64%
1 ene 2012 año
86.978
-4.946
-5.38%
1 ene 2013 año
82.75
-4.228
-4.86%
1 ene 2014 año
79.278
-3.472
-4.2%
1 ene 2015 año
76.714
-2.564
-3.23%
1 ene 2016 año
74.355
-2.359
-3.08%
1 ene 2017 año
72.165
-2.19
-2.95%
Ranking de los países por los datos estadísticos actuales


Comentarios: