29
/es/
es
AIzaSyAYiBZKx7MnpbEhh9jyipgxe19OcubqV5w
April 1, 2024
266693
Trinidad and Tobago
TTO
true
2
1
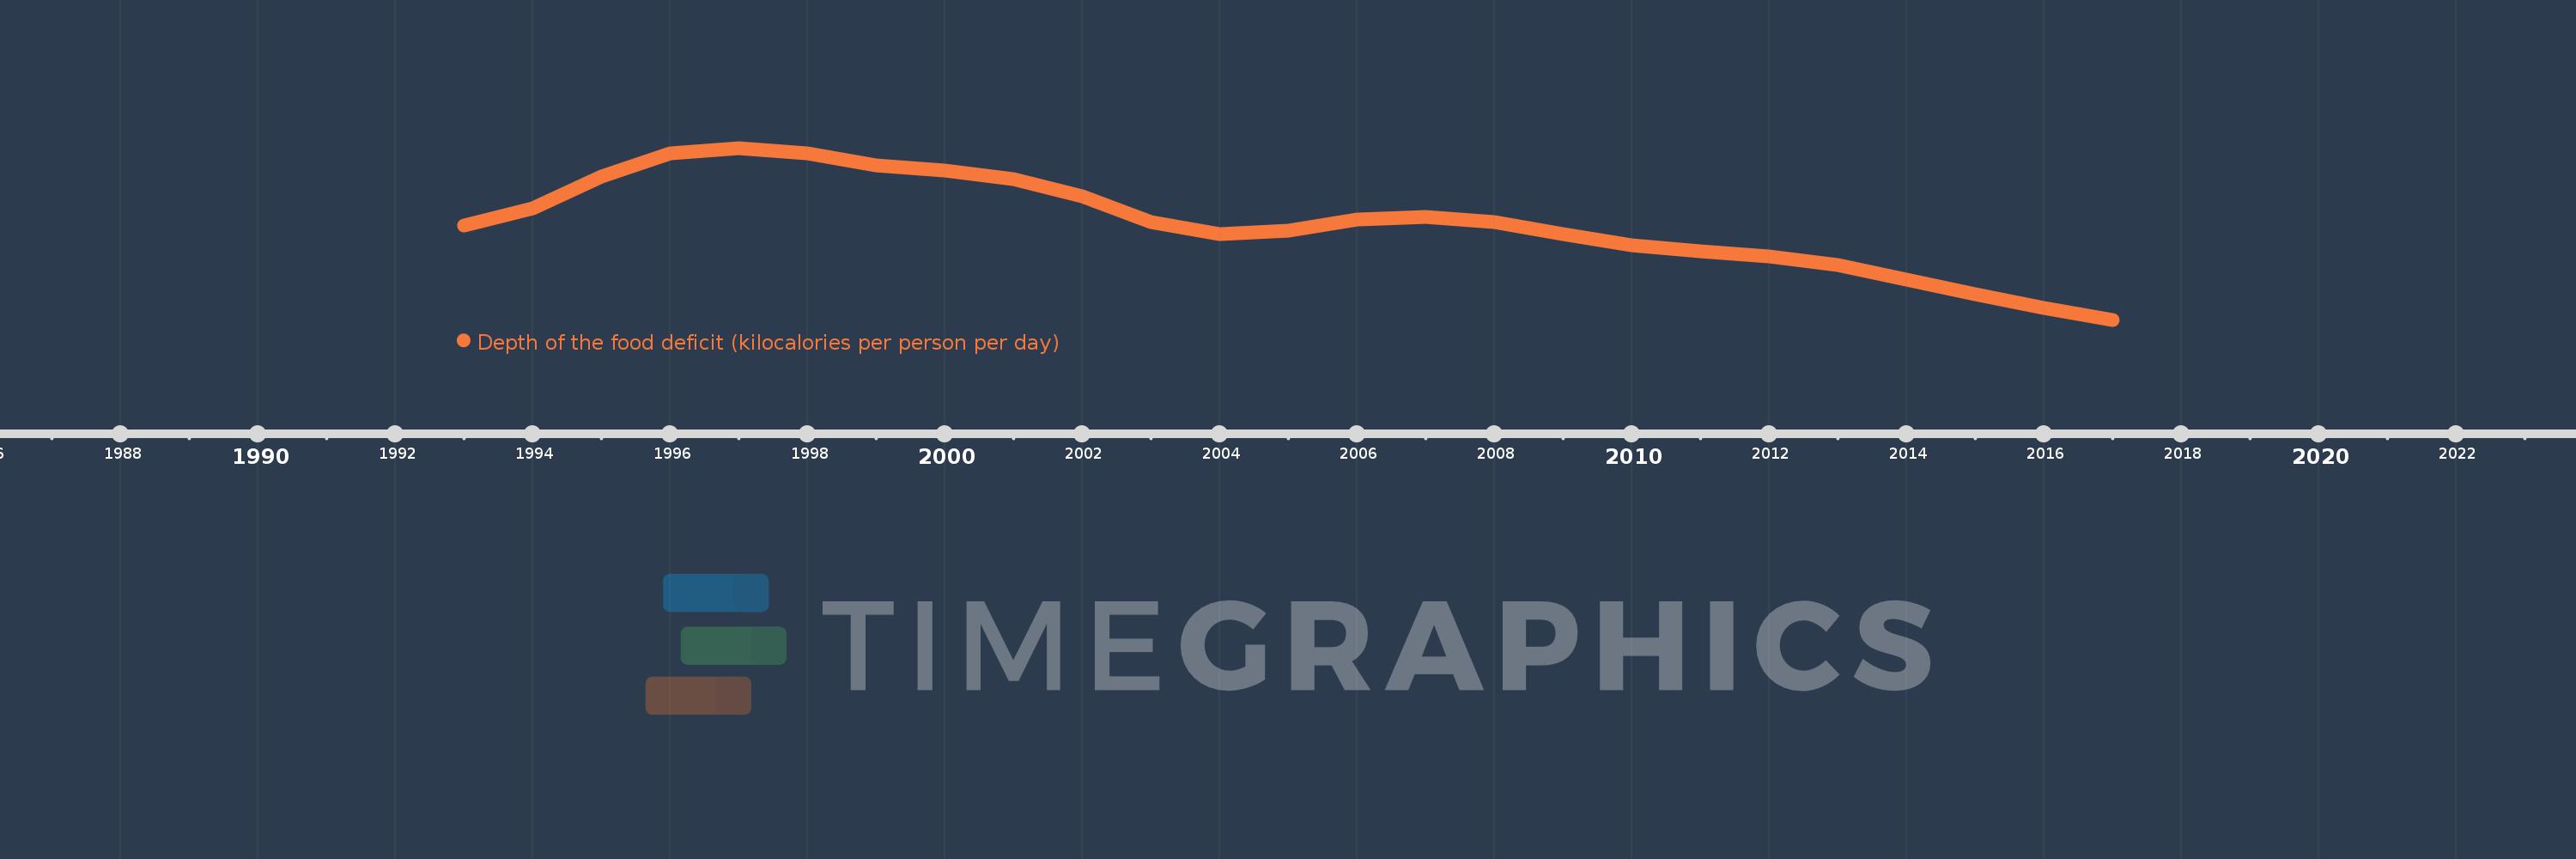
Depth of the food deficit (kilocalories per person per day)
2017,2016,2015,2014,2013,2012,2011,2010,2009,2008,2007,2006,2005,2004,2003,2002,2001,2000,1999,1998,1997,1996,1995,1994,1993
Estas estadísticas en otros países:
línea de tiempo (timeline):
En esta escala de tiempo se presenta un gráfico de 1993 y 2017 de Trinidad and Tobago. Los datos de 1992 están ausentes. El número de observaciones reales por fecha: 25.
Fuente (nombre):
Indicadores del desarrollo mundial
Fuente (organización):
Food and Agriculture Organization, Food Security Statistics.
Categorías:
Health
Se ha actualizado:
23 abr 2017 año
Los indicadores de los cambios de valor en los últimos años
Mínimo:
55.0
1 ene 2017 año
Máximo:
115.0
1 ene 1997 año
A la fecha de observación
Valor
Cambio absoluto
El cambio con respecto al valor anterior
1 ene 1993 año
88.0
+88.0
0.0%
1 ene 1994 año
94.0
+6.0
6.82%
1 ene 1995 año
105.0
+11.0
11.7%
1 ene 1996 año
113.0
+8.0
7.62%
1 ene 1997 año
115.0
+2.0
1.77%
1 ene 1998 año
113.0
-2.0
-1.74%
1 ene 1999 año
109.0
-4.0
-3.54%
1 ene 2000 año
107.0
-2.0
-1.83%
1 ene 2001 año
104.0
-3.0
-2.8%
1 ene 2002 año
98.0
-6.0
-5.77%
1 ene 2003 año
89.0
-9.0
-9.18%
1 ene 2004 año
85.0
-4.0
-4.49%
1 ene 2005 año
86.0
+1.0
1.18%
1 ene 2006 año
90.0
+4.0
4.65%
1 ene 2007 año
91.0
+1.0
1.11%
1 ene 2008 año
89.0
-2.0
-2.2%
1 ene 2009 año
85.0
-4.0
-4.49%
1 ene 2010 año
81.0
-4.0
-4.71%
1 ene 2011 año
79.0
-2.0
-2.47%
1 ene 2012 año
77.0
-2.0
-2.53%
1 ene 2013 año
74.0
-3.0
-3.9%
1 ene 2014 año
69.0
-5.0
-6.76%
1 ene 2015 año
64.0
-5.0
-7.25%
1 ene 2016 año
59.0
-5.0
-7.81%
1 ene 2017 año
55.0
-4.0
-6.78%
Ranking de los países por los datos estadísticos actuales


Comentarios: