29
/es/
es
AIzaSyAYiBZKx7MnpbEhh9jyipgxe19OcubqV5w
April 1, 2024
178728
Liberia
LBR
true
2
1
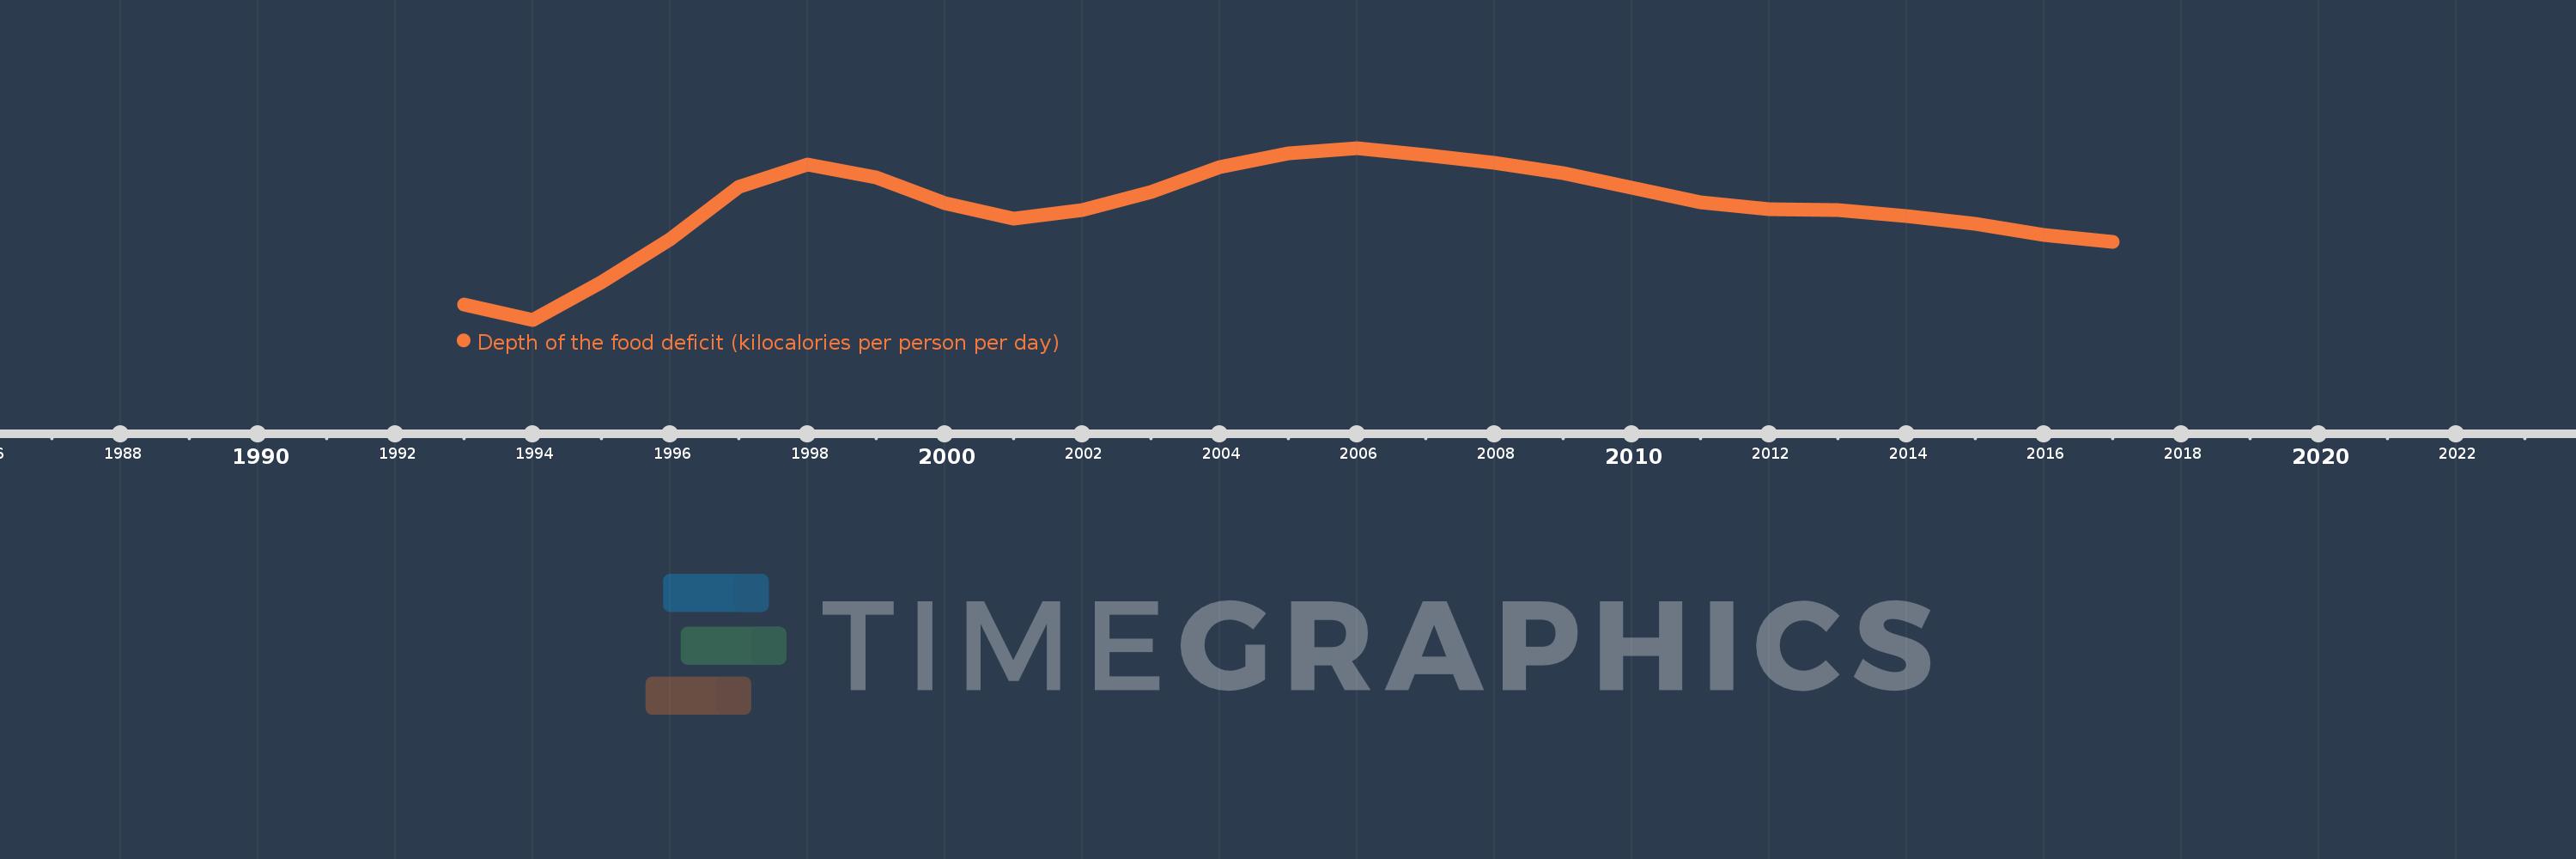
Depth of the food deficit (kilocalories per person per day)
2017,2016,2015,2014,2013,2012,2011,2010,2009,2008,2007,2006,2005,2004,2003,2002,2001,2000,1999,1998,1997,1996,1995,1994,1993
Estas estadísticas en otros países:
línea de tiempo (timeline):
En esta escala de tiempo se presenta un gráfico de 1993 y 2017 de Liberia. Los datos de 1992 están ausentes. El número de observaciones reales por fecha: 25.
Fuente (nombre):
Indicadores del desarrollo mundial
Fuente (organización):
Food and Agriculture Organization, Food Security Statistics.
Categorías:
Health
Se ha actualizado:
23 abr 2017 año
Los indicadores de los cambios de valor en los últimos años
Mínimo:
200.0
1 ene 1994 año
Máximo:
324.0
1 ene 2006 año
A la fecha de observación
Valor
Cambio absoluto
El cambio con respecto al valor anterior
1 ene 1993 año
211.0
+211.0
0.0%
1 ene 1994 año
200.0
-11.0
-5.21%
1 ene 1995 año
227.0
+27.0
13.5%
1 ene 1996 año
258.0
+31.0
13.66%
1 ene 1997 año
296.0
+38.0
14.73%
1 ene 1998 año
312.0
+16.0
5.41%
1 ene 1999 año
303.0
-9.0
-2.88%
1 ene 2000 año
284.0
-19.0
-6.27%
1 ene 2001 año
273.0
-11.0
-3.87%
1 ene 2002 año
279.0
+6.0
2.2%
1 ene 2003 año
292.0
+13.0
4.66%
1 ene 2004 año
310.0
+18.0
6.16%
1 ene 2005 año
320.0
+10.0
3.23%
1 ene 2006 año
324.0
+4.0
1.25%
1 ene 2007 año
319.0
-5.0
-1.54%
1 ene 2008 año
313.0
-6.0
-1.88%
1 ene 2009 año
306.0
-7.0
-2.24%
1 ene 2010 año
295.0
-11.0
-3.59%
1 ene 2011 año
285.0
-10.0
-3.39%
1 ene 2012 año
280.0
-5.0
-1.75%
1 ene 2013 año
279.0
-1.0
-0.36%
1 ene 2014 año
275.0
-4.0
-1.43%
1 ene 2015 año
269.0
-6.0
-2.18%
1 ene 2016 año
261.0
-8.0
-2.97%
1 ene 2017 año
256.0
-5.0
-1.92%
Ranking de los países por los datos estadísticos actuales


Comentarios: