29
/es/
es
AIzaSyAYiBZKx7MnpbEhh9jyipgxe19OcubqV5w
April 1, 2024
48883
Middle East & North Africa (excluding high income)
MNA
false
2
1
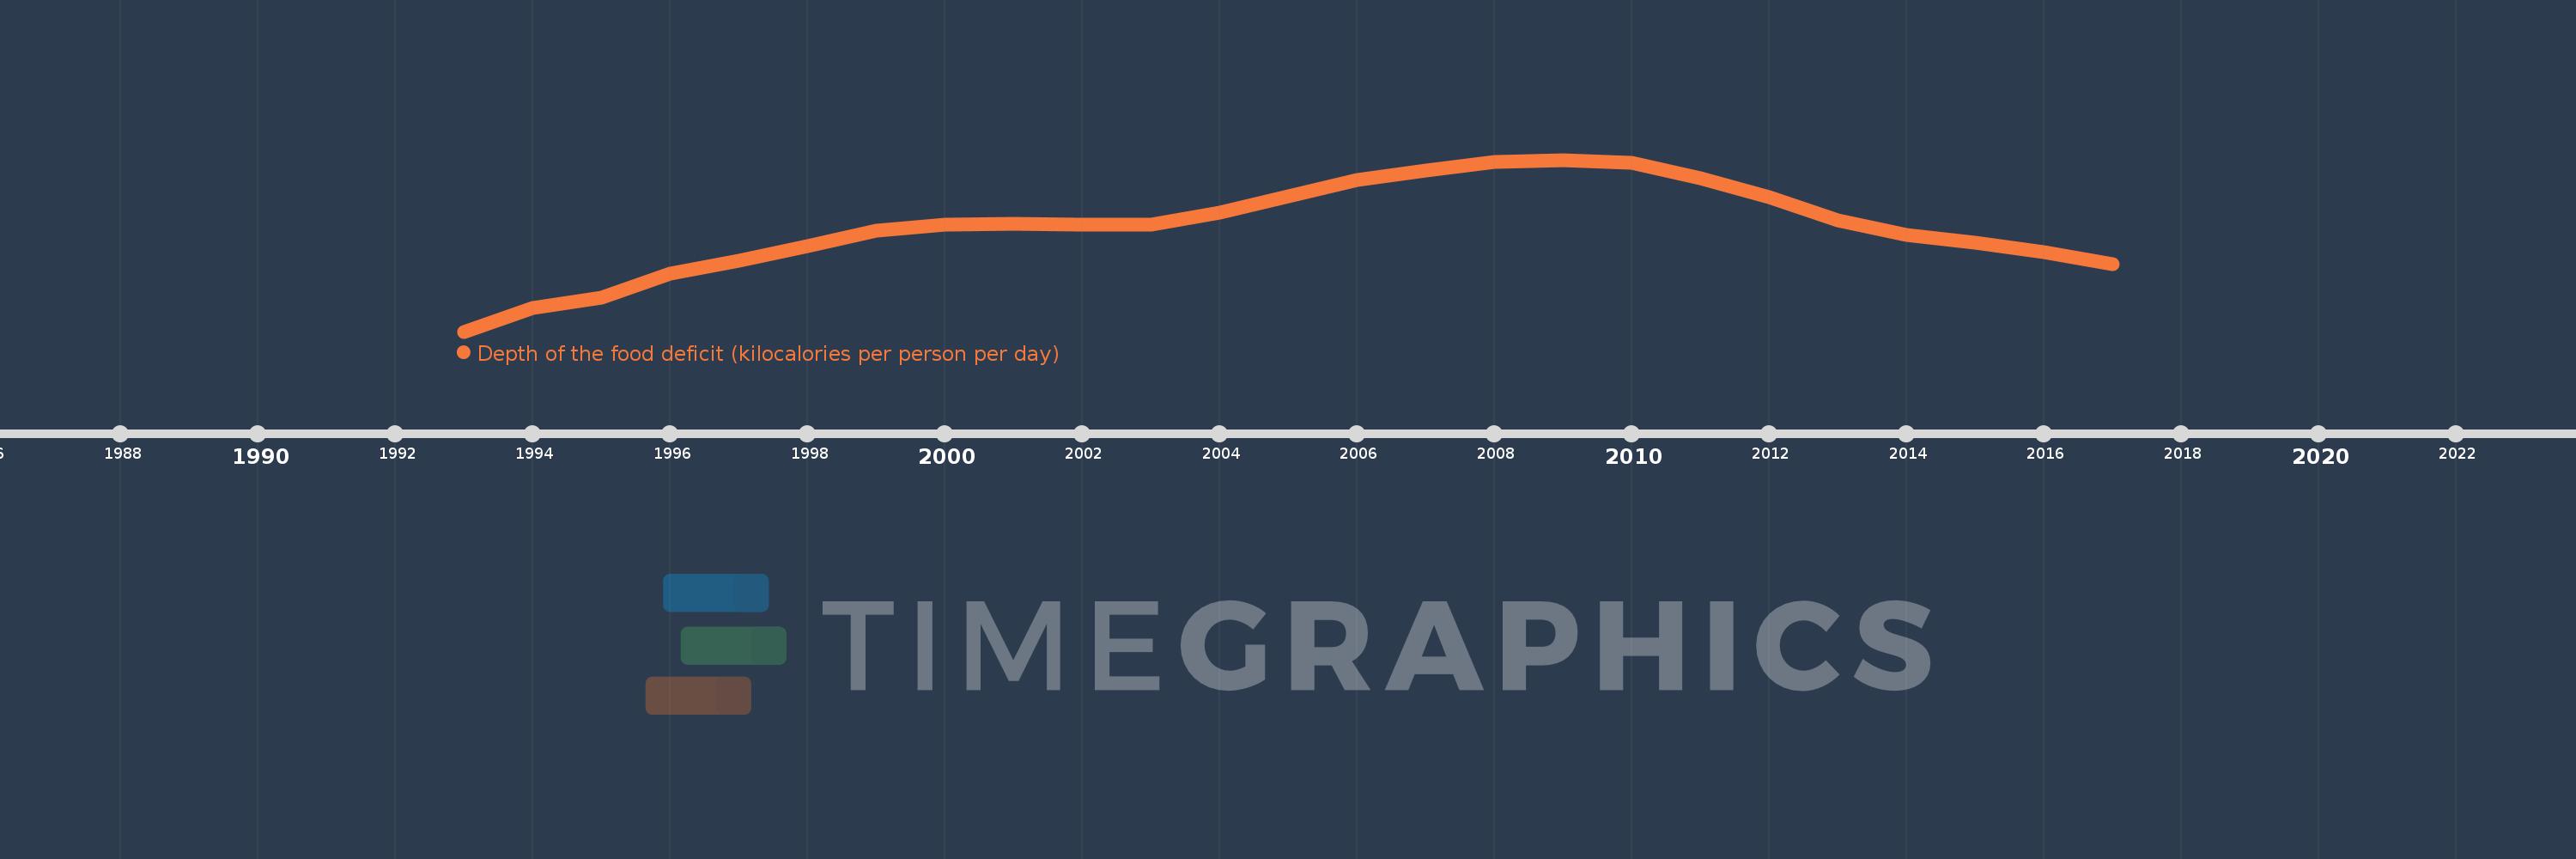
Depth of the food deficit (kilocalories per person per day)
2017,2016,2015,2014,2013,2012,2011,2010,2009,2008,2007,2006,2005,2004,2003,2002,2001,2000,1999,1998,1997,1996,1995,1994,1993
Estas estadísticas en otros países:
línea de tiempo (timeline):
En esta escala de tiempo se presenta un gráfico de 1993 y 2017 de Middle East & North Africa (excluding high income). Los datos de 1992 están ausentes. El número de observaciones reales por fecha: 25.
Fuente (nombre):
Indicadores del desarrollo mundial
Fuente (organización):
Food and Agriculture Organization, Food Security Statistics.
Categorías:
Health
Se ha actualizado:
23 abr 2017 año
Los indicadores de los cambios de valor en los últimos años
Mínimo:
43.633
1 ene 1993 año
Máximo:
66.423
1 ene 2009 año
A la fecha de observación
Valor
Cambio absoluto
El cambio con respecto al valor anterior
1 ene 1993 año
43.633
+43.633
0.0%
1 ene 1994 año
46.779
+3.146
7.21%
1 ene 1995 año
48.156
+1.377
2.94%
1 ene 1996 año
51.339
+3.183
6.61%
1 ene 1997 año
53.087
+1.748
3.4%
1 ene 1998 año
55.0
+1.913
3.6%
1 ene 1999 año
57.007
+2.008
3.65%
1 ene 2000 año
57.85
+0.843
1.48%
1 ene 2001 año
57.96
+0.11
0.19%
1 ene 2002 año
57.839
-0.121
-0.21%
1 ene 2003 año
57.839
0.0
0.0%
1 ene 2004 año
59.46
+1.621
2.8%
1 ene 2005 año
61.543
+2.083
3.5%
1 ene 2006 año
63.708
+2.165
3.52%
1 ene 2007 año
64.968
+1.26
1.98%
1 ene 2008 año
66.117
+1.149
1.77%
1 ene 2009 año
66.423
+0.306
0.46%
1 ene 2010 año
66.011
-0.412
-0.62%
1 ene 2011 año
64.02
-1.991
-3.02%
1 ene 2012 año
61.478
-2.542
-3.97%
1 ene 2013 año
58.343
-3.135
-5.1%
1 ene 2014 año
56.43
-1.913
-3.28%
1 ene 2015 año
55.425
-1.005
-1.78%
1 ene 2016 año
54.124
-1.302
-2.35%
1 ene 2017 año
52.577
-1.546
-2.86%
Ranking de los países por los datos estadísticos actuales


Comentarios: