29
/es/
es
AIzaSyAYiBZKx7MnpbEhh9jyipgxe19OcubqV5w
April 1, 2024
259428
Tajikistan
TJK
true
2
1
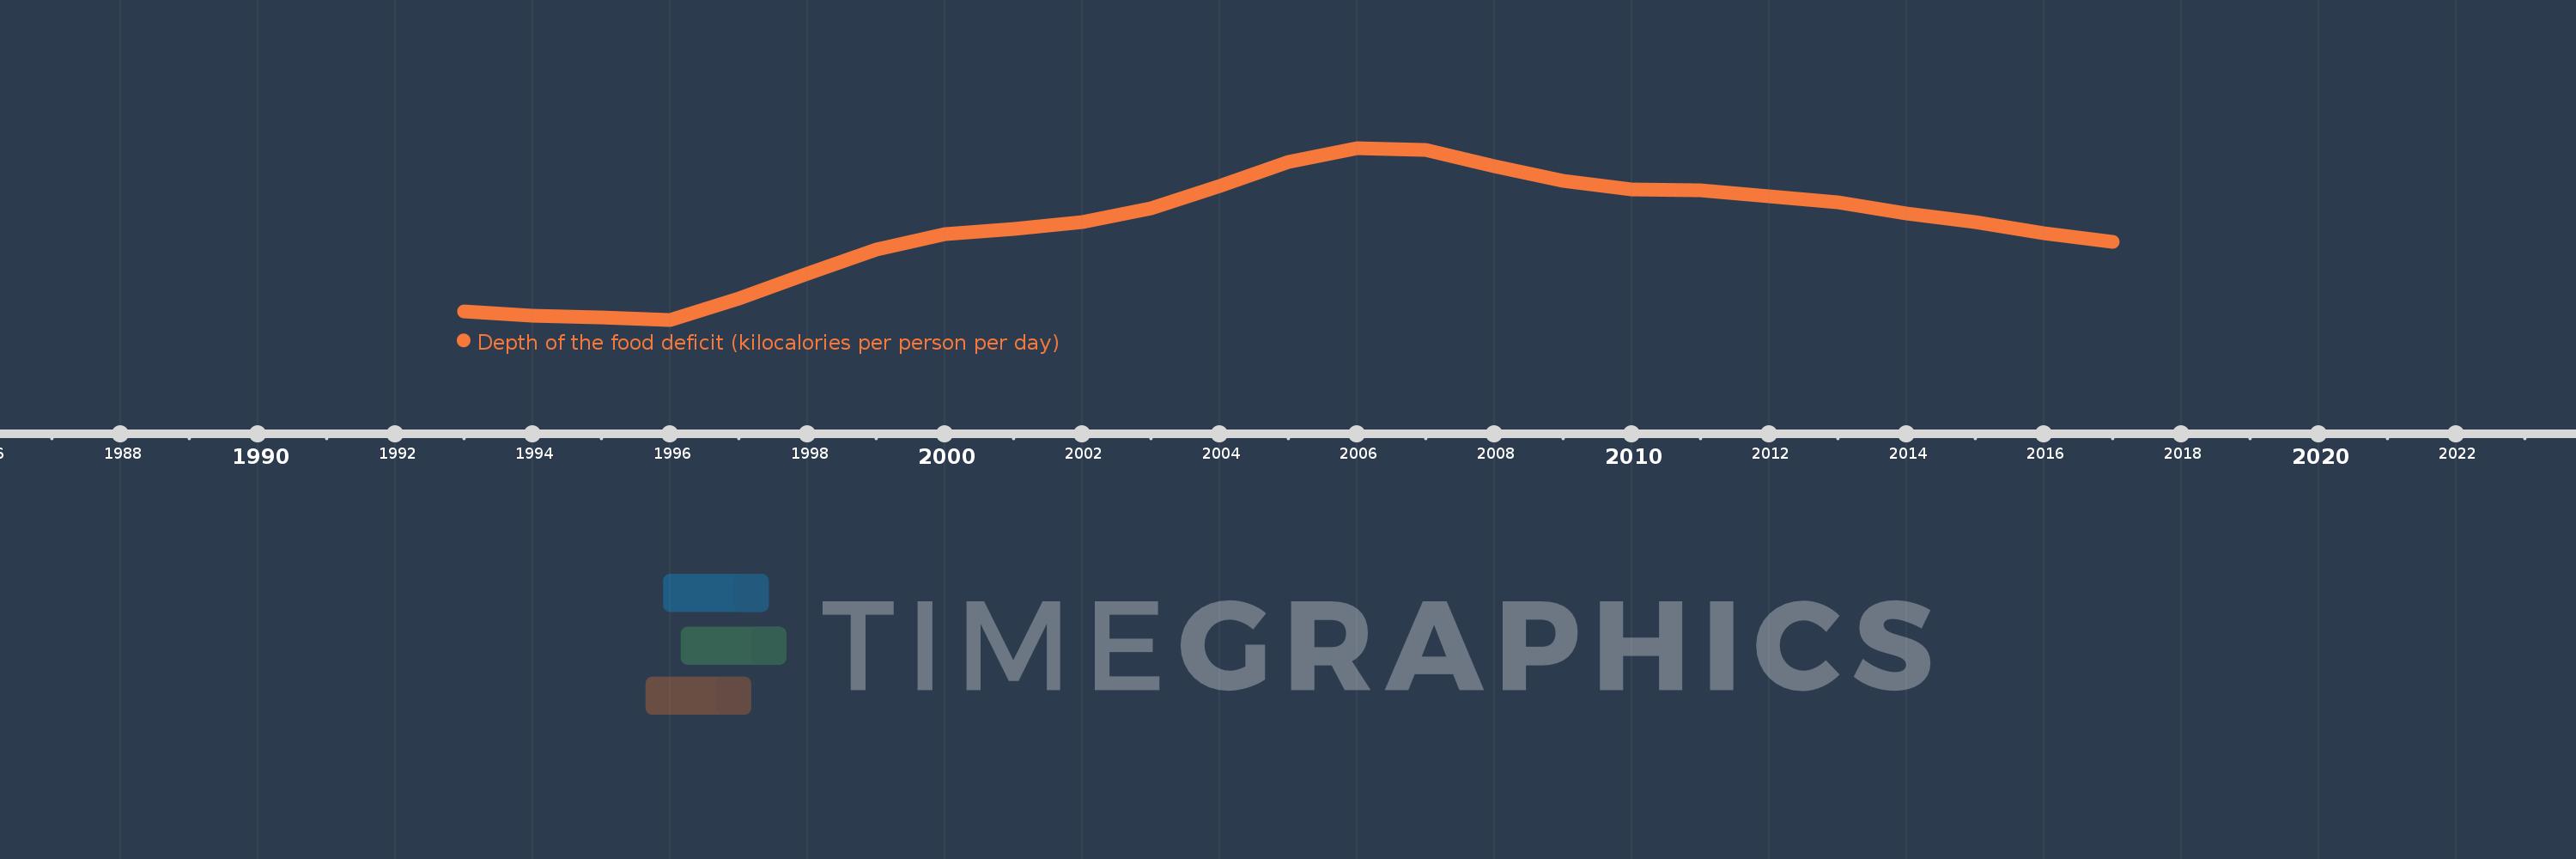
Depth of the food deficit (kilocalories per person per day)
2017,2016,2015,2014,2013,2012,2011,2010,2009,2008,2007,2006,2005,2004,2003,2002,2001,2000,1999,1998,1997,1996,1995,1994,1993
Estas estadísticas en otros países:
línea de tiempo (timeline):
En esta escala de tiempo se presenta un gráfico de 1993 y 2017 de Tajikistan. Los datos de 1992 están ausentes. El número de observaciones reales por fecha: 25.
Fuente (nombre):
Indicadores del desarrollo mundial
Fuente (organización):
Food and Agriculture Organization, Food Security Statistics.
Categorías:
Health
Se ha actualizado:
23 abr 2017 año
Los indicadores de los cambios de valor en los últimos años
Mínimo:
179.0
1 ene 1996 año
Máximo:
336.0
1 ene 2006 año
A la fecha de observación
Valor
Cambio absoluto
El cambio con respecto al valor anterior
1 ene 1993 año
187.0
+187.0
0.0%
1 ene 1994 año
183.0
-4.0
-2.14%
1 ene 1995 año
181.0
-2.0
-1.09%
1 ene 1996 año
179.0
-2.0
-1.1%
1 ene 1997 año
198.0
+19.0
10.61%
1 ene 1998 año
221.0
+23.0
11.62%
1 ene 1999 año
243.0
+22.0
9.95%
1 ene 2000 año
257.0
+14.0
5.76%
1 ene 2001 año
262.0
+5.0
1.95%
1 ene 2002 año
268.0
+6.0
2.29%
1 ene 2003 año
281.0
+13.0
4.85%
1 ene 2004 año
301.0
+20.0
7.12%
1 ene 2005 año
323.0
+22.0
7.31%
1 ene 2006 año
336.0
+13.0
4.02%
1 ene 2007 año
334.0
-2.0
-0.6%
1 ene 2008 año
319.0
-15.0
-4.49%
1 ene 2009 año
306.0
-13.0
-4.08%
1 ene 2010 año
298.0
-8.0
-2.61%
1 ene 2011 año
297.0
-1.0
-0.34%
1 ene 2012 año
292.0
-5.0
-1.68%
1 ene 2013 año
286.0
-6.0
-2.05%
1 ene 2014 año
276.0
-10.0
-3.5%
1 ene 2015 año
268.0
-8.0
-2.9%
1 ene 2016 año
258.0
-10.0
-3.73%
1 ene 2017 año
250.0
-8.0
-3.1%
Ranking de los países por los datos estadísticos actuales


Comentarios: