29
/fr/
fr
AIzaSyAYiBZKx7MnpbEhh9jyipgxe19OcubqV5w
April 1, 2024
36472
IBRD only
IBD
false
2
1
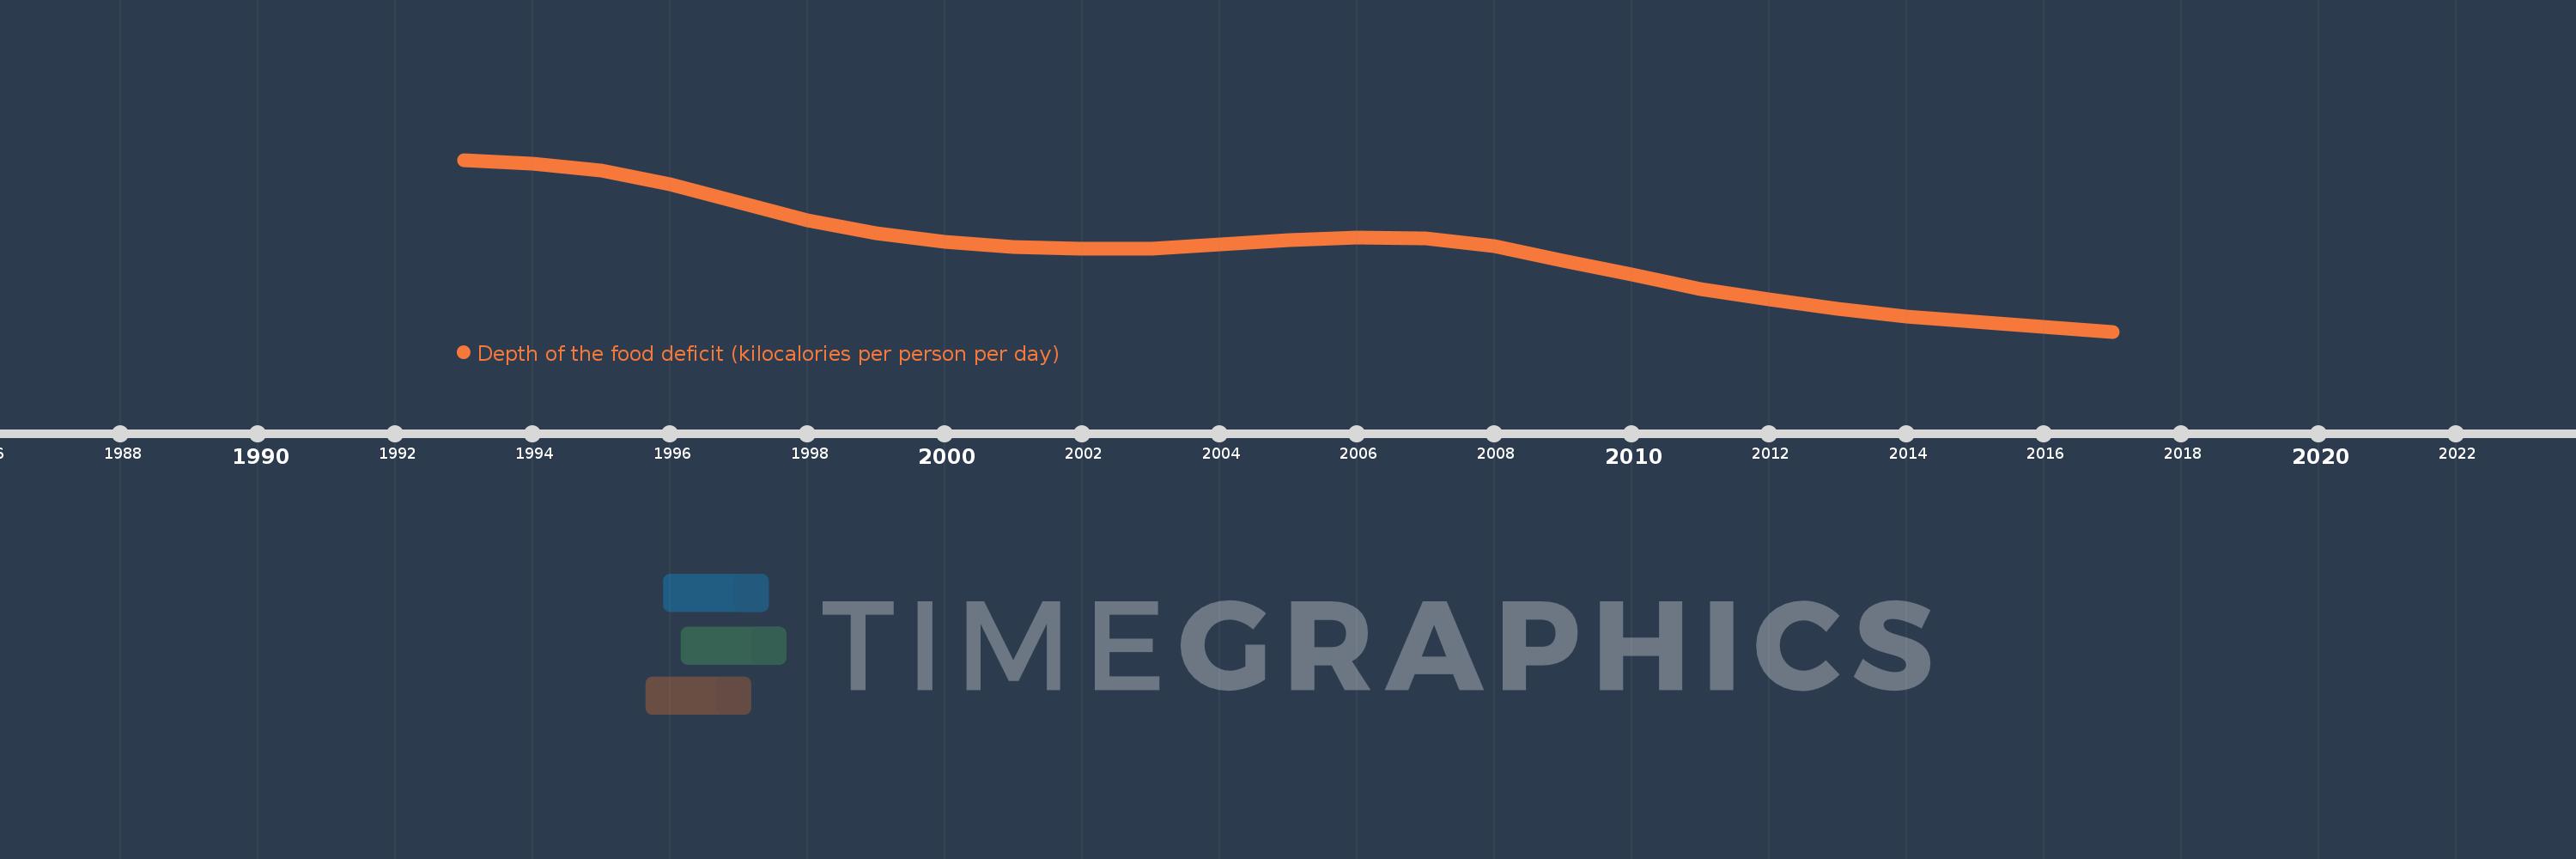
Depth of the food deficit (kilocalories per person per day)
2017,2016,2015,2014,2013,2012,2011,2010,2009,2008,2007,2006,2005,2004,2003,2002,2001,2000,1999,1998,1997,1996,1995,1994,1993
Cette statistique dans les autres pays:
La ligne de temps
Cette échelle de temps montre un graphique de 1993 année à 2017 année IBRD only. Les données jusqu'à 1992 année ne sont pas présentés. Quantité d'observations actuelles selon dates: 25.
Source (désignation):
Les indicateurs du développement mondiale
Source (organisation):
Food and Agriculture Organization, Food Security Statistics.
Catégories:
Health
Dernière mise à jour
23 avr. 2017
Les indicateurs de changement de valeurs selon les années
Minimum:
72.165
1 janv. 2017
Maximum:
151.721
1 janv. 1993
Pour la date d''observation
Valeur
Changement absolu
Le changement par rapport à la valeur précédente
1 janv. 1993
151.721
+151.721
0.0%
1 janv. 1994
149.969
-1.752
-1.15%
1 janv. 1995
146.758
-3.211
-2.14%
1 janv. 1996
140.263
-6.495
-4.43%
1 janv. 1997
132.131
-8.132
-5.8%
1 janv. 1998
123.848
-8.283
-6.27%
1 janv. 1999
117.851
-5.997
-4.84%
1 janv. 2000
113.817
-4.035
-3.42%
1 janv. 2001
111.531
-2.285
-2.01%
1 janv. 2002
110.356
-1.175
-1.05%
1 janv. 2003
110.461
+0.105
0.1%
1 janv. 2004
112.445
+1.984
1.8%
1 janv. 2005
114.464
+2.019
1.8%
1 janv. 2006
115.762
+1.298
1.13%
1 janv. 2007
115.212
-0.549
-0.47%
1 janv. 2008
111.556
-3.656
-3.17%
1 janv. 2009
105.054
-6.502
-5.83%
1 janv. 2010
98.467
-6.587
-6.27%
1 janv. 2011
91.925
-6.542
-6.64%
1 janv. 2012
86.978
-4.946
-5.38%
1 janv. 2013
82.75
-4.228
-4.86%
1 janv. 2014
79.278
-3.472
-4.2%
1 janv. 2015
76.714
-2.564
-3.23%
1 janv. 2016
74.355
-2.359
-3.08%
1 janv. 2017
72.165
-2.19
-2.95%
Classement des pays selon les statistiques actuelles par années


Commentaires: