29
/fr/
fr
AIzaSyAYiBZKx7MnpbEhh9jyipgxe19OcubqV5w
April 1, 2024
112078
Costa Rica
CRI
true
2
1
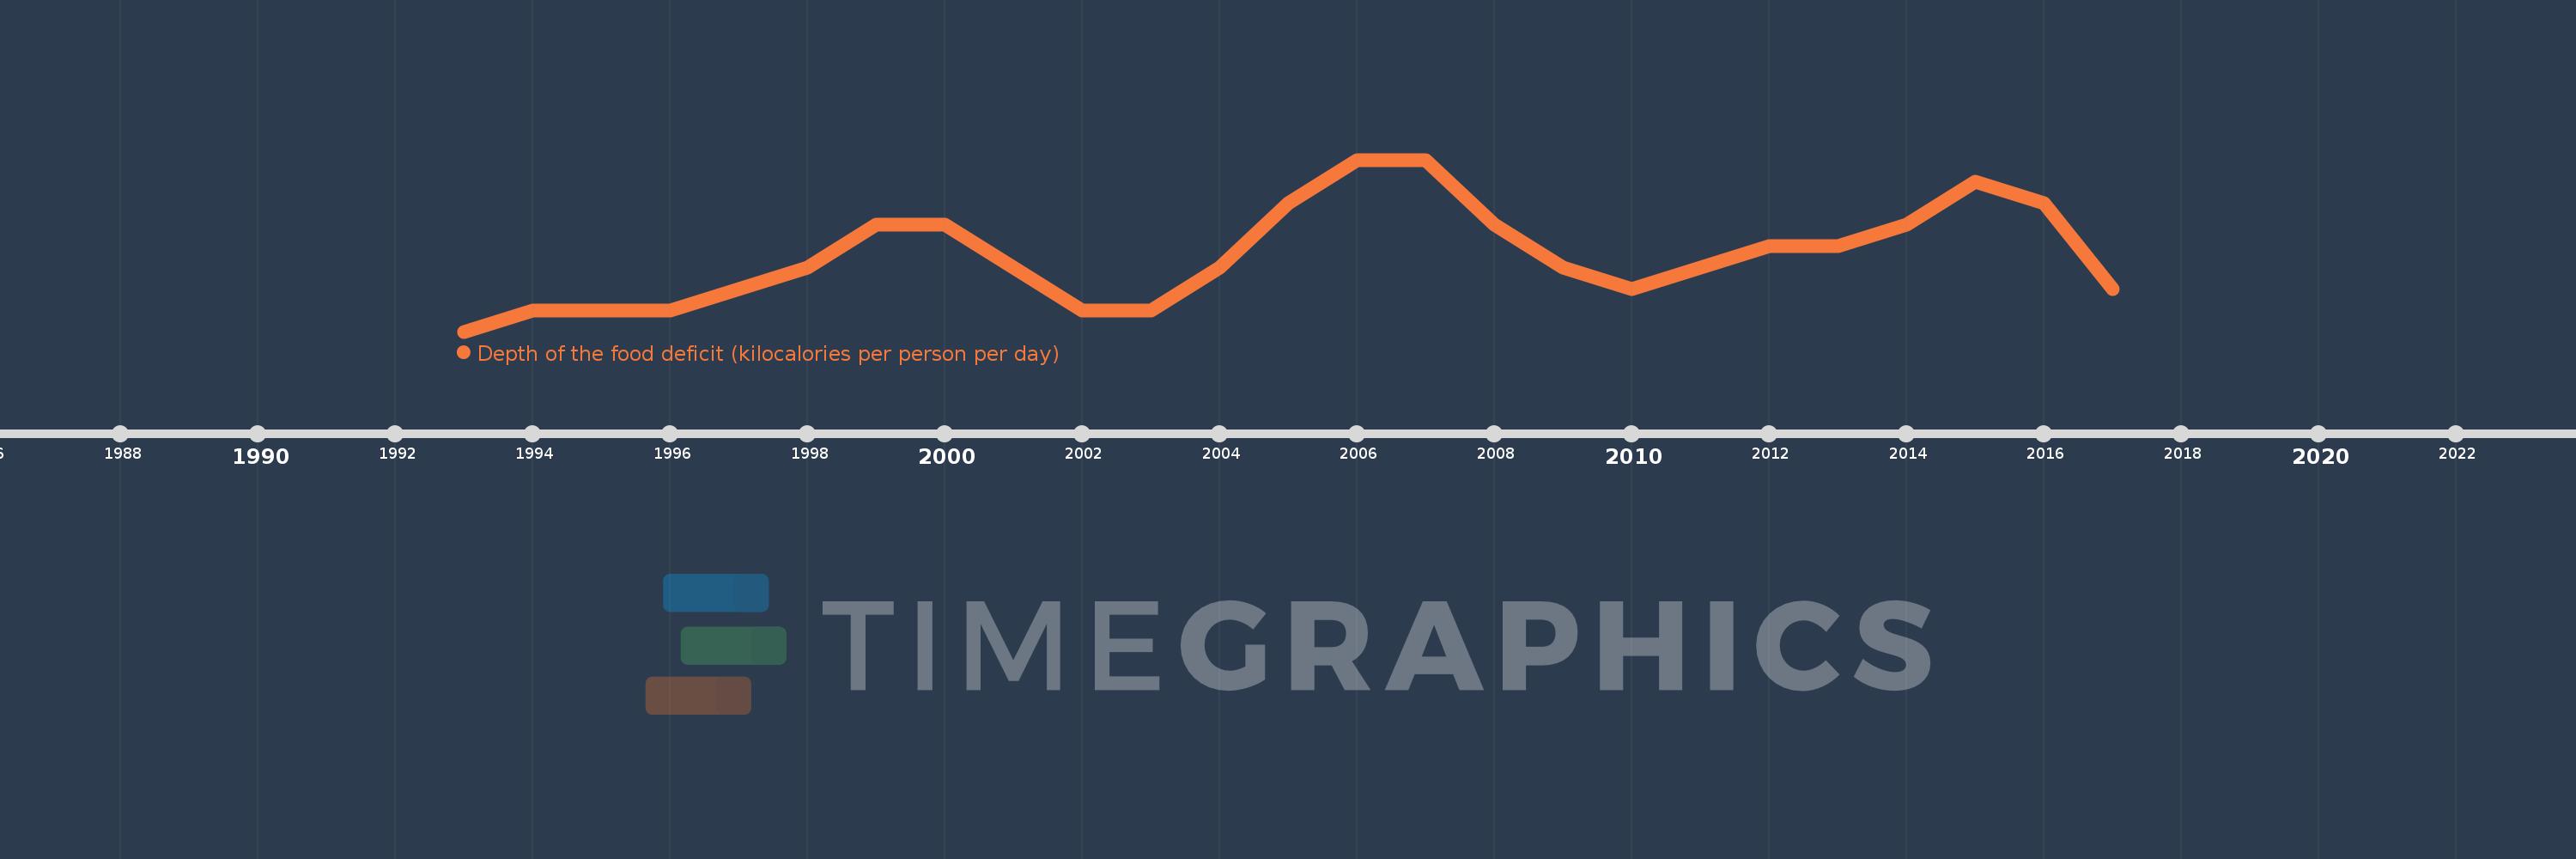
Depth of the food deficit (kilocalories per person per day)
2017,2016,2015,2014,2013,2012,2011,2010,2009,2008,2007,2006,2005,2004,2003,2002,2001,2000,1999,1998,1997,1996,1995,1994,1993
Cette statistique dans les autres pays:
La ligne de temps
Cette échelle de temps montre un graphique de 1993 année à 2017 année Costa Rica. Les données jusqu'à 1992 année ne sont pas présentés. Quantité d'observations actuelles selon dates: 25.
Source (désignation):
Les indicateurs du développement mondiale
Source (organisation):
Food and Agriculture Organization, Food Security Statistics.
Catégories:
Health
Dernière mise à jour
23 avr. 2017
Les indicateurs de changement de valeurs selon les années
Pour la date d''observation
Valeur
Changement absolu
Le changement par rapport à la valeur précédente
1 janv. 1993
33.0
+33.0
0.0%
1 janv. 1994
34.0
+1.0
3.03%
1 janv. 1995
34.0
0.0
0.0%
1 janv. 1996
34.0
0.0
0.0%
1 janv. 1997
35.0
+1.0
2.94%
1 janv. 1998
36.0
+1.0
2.86%
1 janv. 1999
38.0
+2.0
5.56%
1 janv. 2000
38.0
0.0
0.0%
1 janv. 2001
36.0
-2.0
-5.26%
1 janv. 2002
34.0
-2.0
-5.56%
1 janv. 2003
34.0
0.0
0.0%
1 janv. 2004
36.0
+2.0
5.88%
1 janv. 2005
39.0
+3.0
8.33%
1 janv. 2006
41.0
+2.0
5.13%
1 janv. 2007
41.0
0.0
0.0%
1 janv. 2008
38.0
-3.0
-7.32%
1 janv. 2009
36.0
-2.0
-5.26%
1 janv. 2010
35.0
-1.0
-2.78%
1 janv. 2011
36.0
+1.0
2.86%
1 janv. 2012
37.0
+1.0
2.78%
1 janv. 2013
37.0
0.0
0.0%
1 janv. 2014
38.0
+1.0
2.7%
1 janv. 2015
40.0
+2.0
5.26%
1 janv. 2016
39.0
-1.0
-2.5%
1 janv. 2017
35.0
-4.0
-10.26%
Classement des pays selon les statistiques actuelles par années


Commentaires: