29
/it/
it
AIzaSyAYiBZKx7MnpbEhh9jyipgxe19OcubqV5w
April 1, 2024
222014
Peru
PER
true
2
1
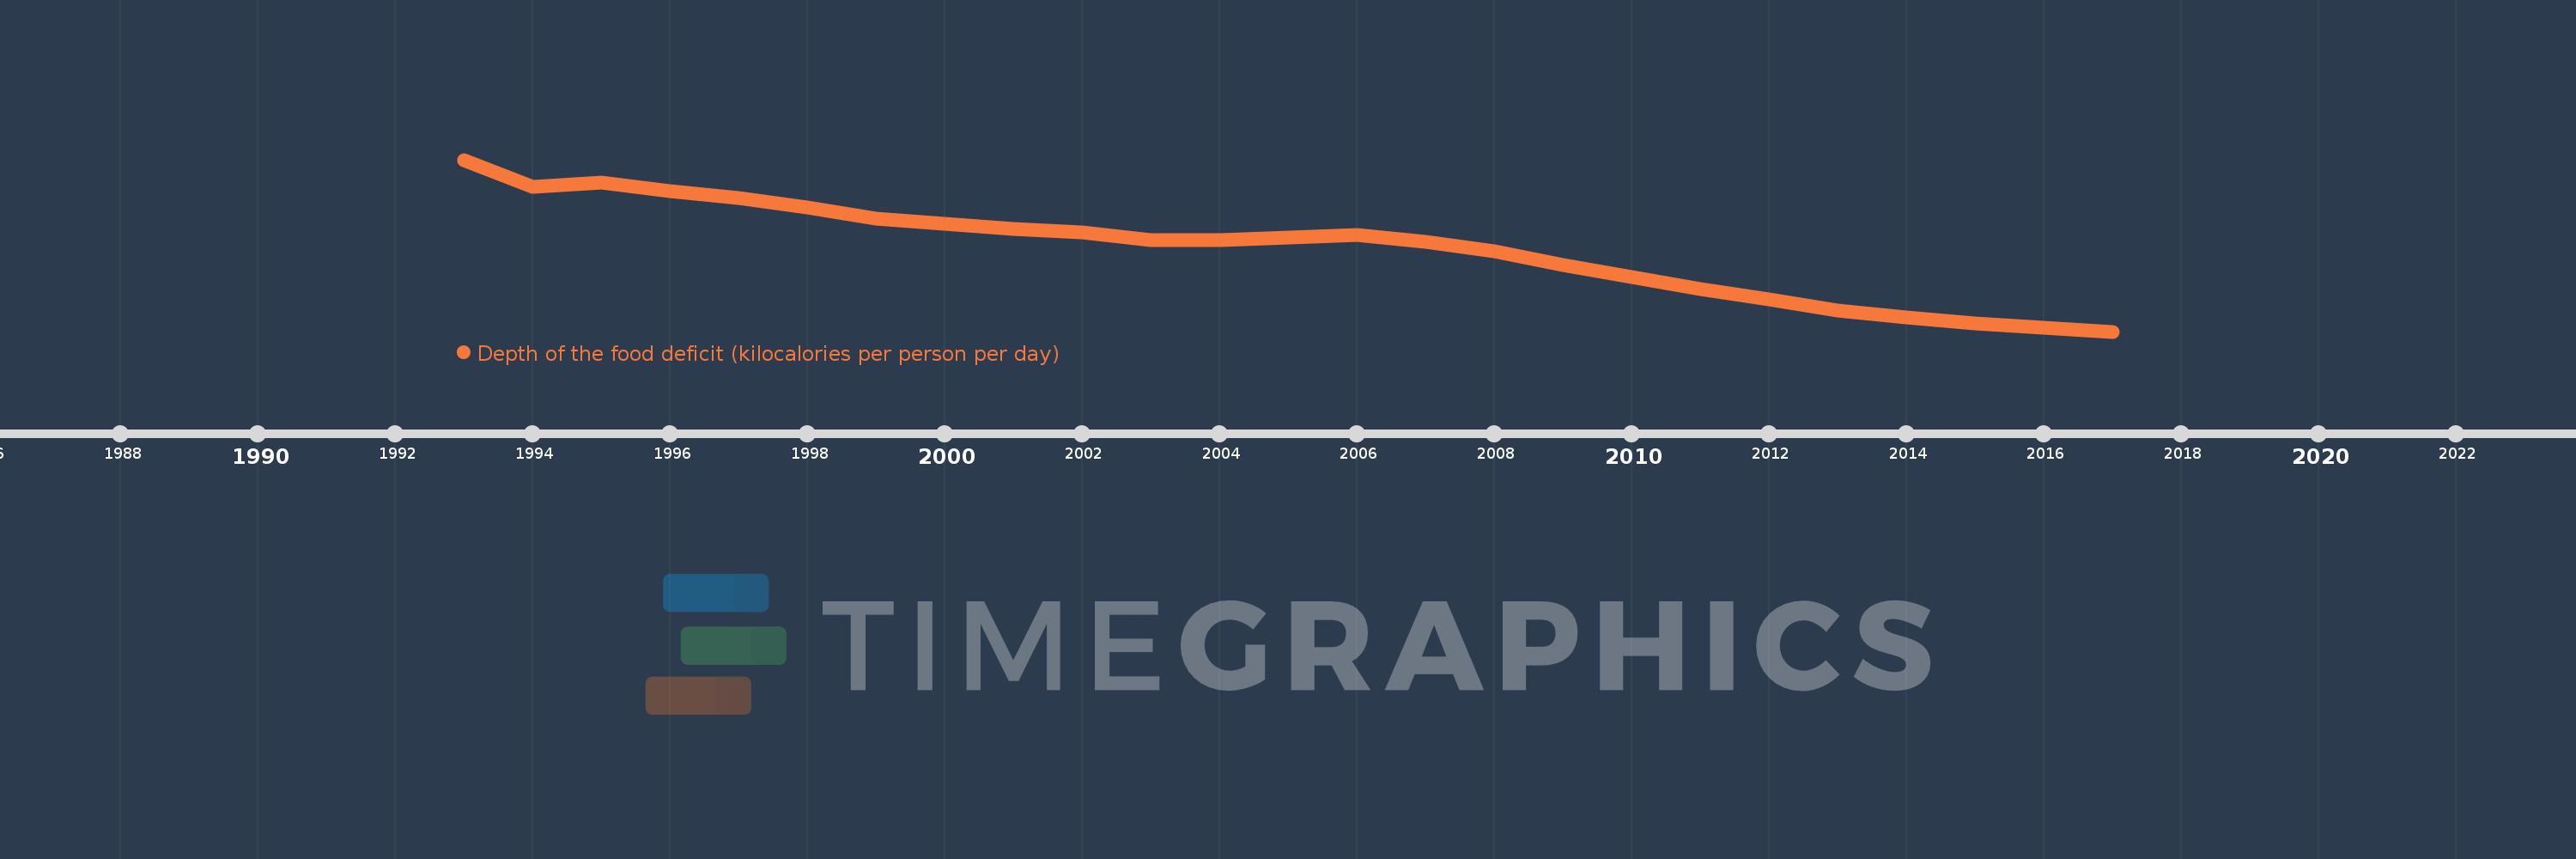
Depth of the food deficit (kilocalories per person per day)
2017,2016,2015,2014,2013,2012,2011,2010,2009,2008,2007,2006,2005,2004,2003,2002,2001,2000,1999,1998,1997,1996,1995,1994,1993
Queste statistiche in altri paesi:
Linea del tempo:
Questa scala temporale mostra un grafico dal 1993 anno al 2017 anno. Peru. I dati fino ad 1992 anno non disponibili. Il numero di osservazioni attuali secondo i date: 25.
La fonte (nome):
Indicatori dello sviluppo mondiale
La fonte (organizzazione):
Food and Agriculture Organization, Food Security Statistics.
Categorie:
Health
sono stati aggiornati
23 apr 2017 anni
Indicatori delle variazioni dei valori per anni
Minima:
50.0
1 gen 2017 anni
Massimo:
222.0
1 gen 1993 anni
Alla data di osservazione
Valore
Variazione assoluta
La variazione rispetto al valore precedente
1 gen 1993 anni
222.0
+222.0
0.0%
1 gen 1994 anni
195.0
-27.0
-12.16%
1 gen 1995 anni
199.0
+4.0
2.05%
1 gen 1996 anni
191.0
-8.0
-4.02%
1 gen 1997 anni
184.0
-7.0
-3.66%
1 gen 1998 anni
174.0
-10.0
-5.43%
1 gen 1999 anni
163.0
-11.0
-6.32%
1 gen 2000 anni
158.0
-5.0
-3.07%
1 gen 2001 anni
153.0
-5.0
-3.16%
1 gen 2002 anni
149.0
-4.0
-2.61%
1 gen 2003 anni
142.0
-7.0
-4.7%
1 gen 2004 anni
142.0
0.0
0.0%
1 gen 2005 anni
144.0
+2.0
1.41%
1 gen 2006 anni
147.0
+3.0
2.08%
1 gen 2007 anni
140.0
-7.0
-4.76%
1 gen 2008 anni
130.0
-10.0
-7.14%
1 gen 2009 anni
117.0
-13.0
-10.0%
1 gen 2010 anni
105.0
-12.0
-10.26%
1 gen 2011 anni
93.0
-12.0
-11.43%
1 gen 2012 anni
82.0
-11.0
-11.83%
1 gen 2013 anni
71.0
-11.0
-13.41%
1 gen 2014 anni
64.0
-7.0
-9.86%
1 gen 2015 anni
58.0
-6.0
-9.38%
1 gen 2016 anni
54.0
-4.0
-6.9%
1 gen 2017 anni
50.0
-4.0
-7.41%
Classificazione dei paesi secondo i statistiche attuali per anni


Commenti: