29
/pt/
pt
AIzaSyAYiBZKx7MnpbEhh9jyipgxe19OcubqV5w
April 1, 2024
222014
Peru
PER
true
2
1
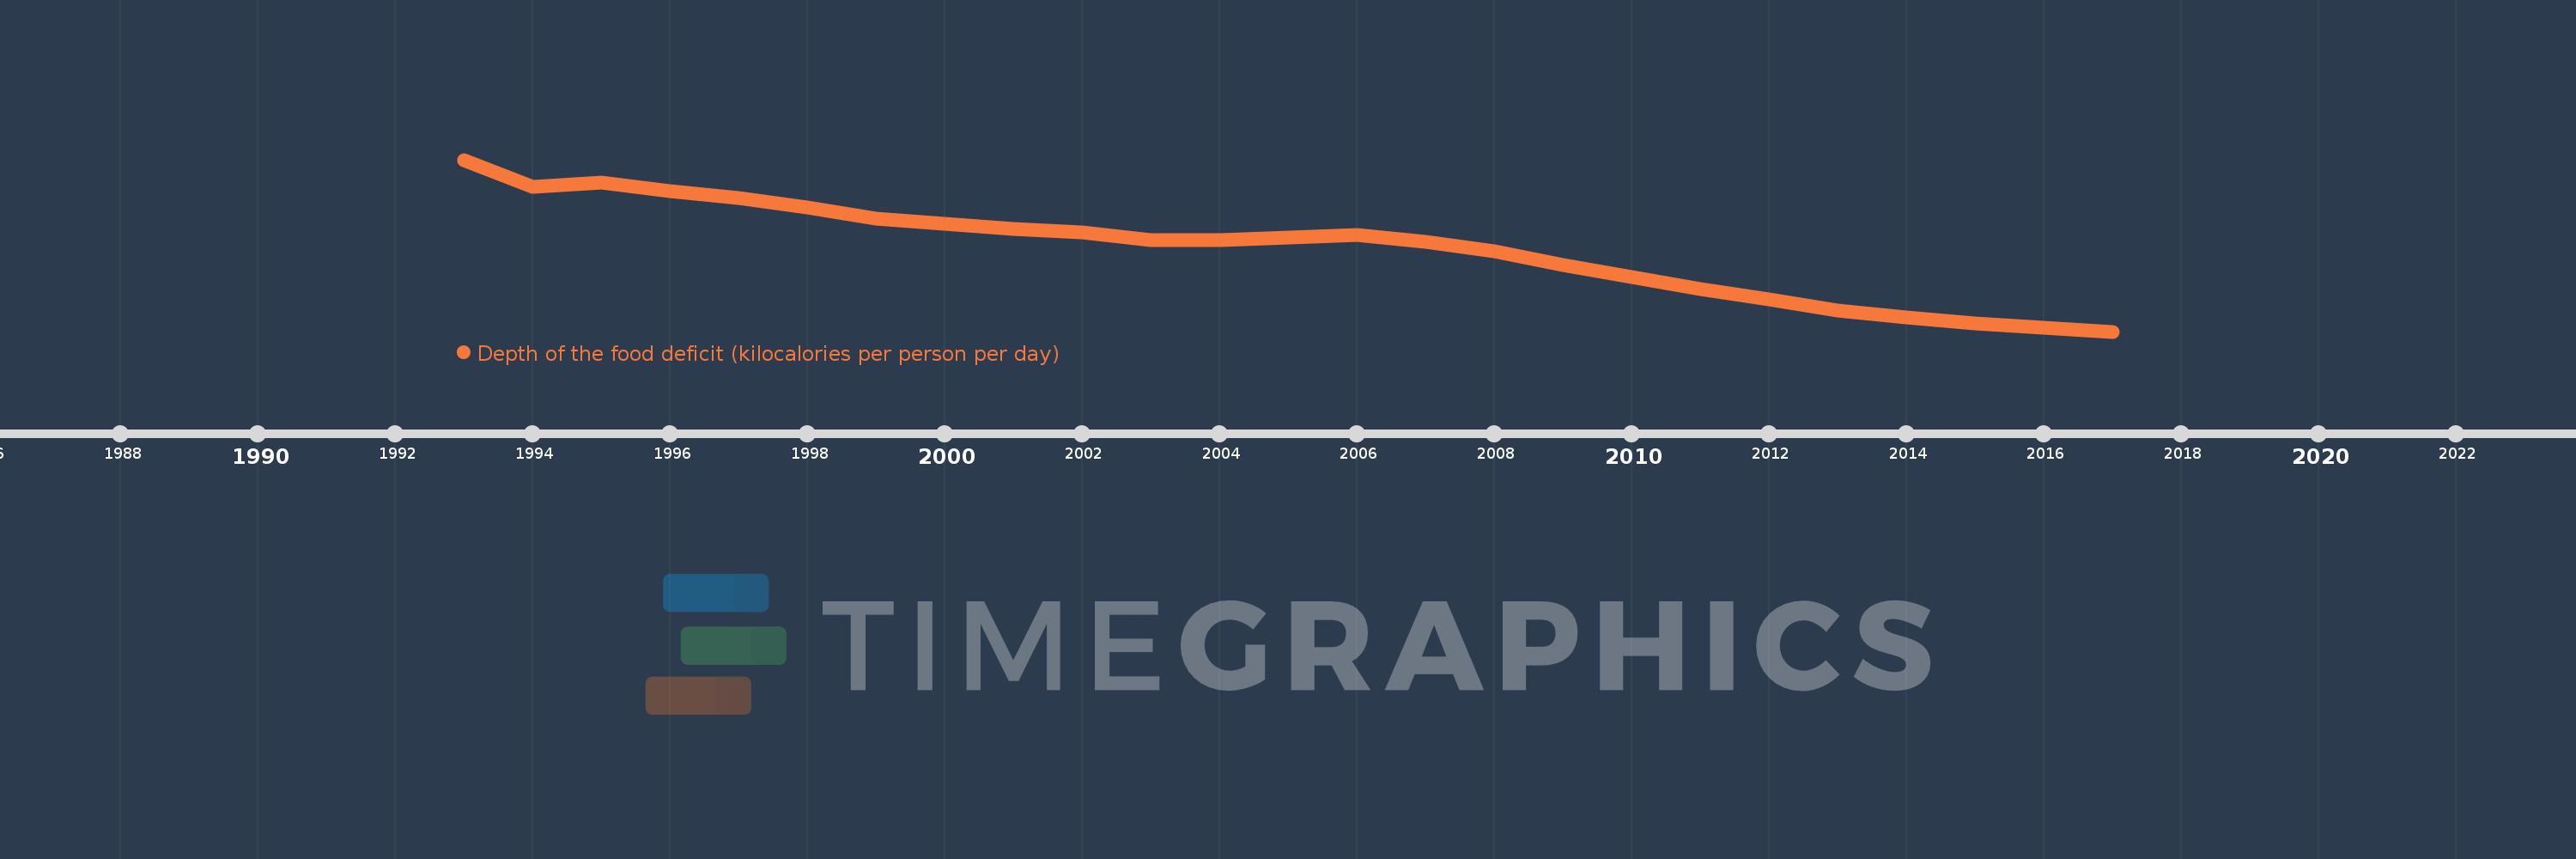
Depth of the food deficit (kilocalories per person per day)
2017,2016,2015,2014,2013,2012,2011,2010,2009,2008,2007,2006,2005,2004,2003,2002,2001,2000,1999,1998,1997,1996,1995,1994,1993
Estas estatísticas em outros países:
Linha do tempo:
Nesta escala de tempo está apresentado um gráfico de 1993 ano até 2017 ano Peru. Dados de 1992 ano ausente. O número de observações reais por data: 25.
Fonte (nome):
Indicadores de desenvolvimento mundial
Fonte (organização):
Food and Agriculture Organization, Food Security Statistics.
Categorias:
Health
Foi atualizado:
23 abr 2017 ano
Indicadores de alterações dos valores ao longo dos anos
Mínimo:
50.0
1 jan 2017 ano
Máximo:
222.0
1 jan 1993 ano
Na data de observação
Valor
Mudança absoluta
A alteração em relação ao valor anterior
1 jan 1993 ano
222.0
+222.0
0.0%
1 jan 1994 ano
195.0
-27.0
-12.16%
1 jan 1995 ano
199.0
+4.0
2.05%
1 jan 1996 ano
191.0
-8.0
-4.02%
1 jan 1997 ano
184.0
-7.0
-3.66%
1 jan 1998 ano
174.0
-10.0
-5.43%
1 jan 1999 ano
163.0
-11.0
-6.32%
1 jan 2000 ano
158.0
-5.0
-3.07%
1 jan 2001 ano
153.0
-5.0
-3.16%
1 jan 2002 ano
149.0
-4.0
-2.61%
1 jan 2003 ano
142.0
-7.0
-4.7%
1 jan 2004 ano
142.0
0.0
0.0%
1 jan 2005 ano
144.0
+2.0
1.41%
1 jan 2006 ano
147.0
+3.0
2.08%
1 jan 2007 ano
140.0
-7.0
-4.76%
1 jan 2008 ano
130.0
-10.0
-7.14%
1 jan 2009 ano
117.0
-13.0
-10.0%
1 jan 2010 ano
105.0
-12.0
-10.26%
1 jan 2011 ano
93.0
-12.0
-11.43%
1 jan 2012 ano
82.0
-11.0
-11.83%
1 jan 2013 ano
71.0
-11.0
-13.41%
1 jan 2014 ano
64.0
-7.0
-9.86%
1 jan 2015 ano
58.0
-6.0
-9.38%
1 jan 2016 ano
54.0
-4.0
-6.9%
1 jan 2017 ano
50.0
-4.0
-7.41%
Classificação de países por estatísticas atuais por anos


Comentários: