29
/pt/
pt
AIzaSyAYiBZKx7MnpbEhh9jyipgxe19OcubqV5w
April 1, 2024
41343
Latin America & Caribbean
LCN
false
2
1
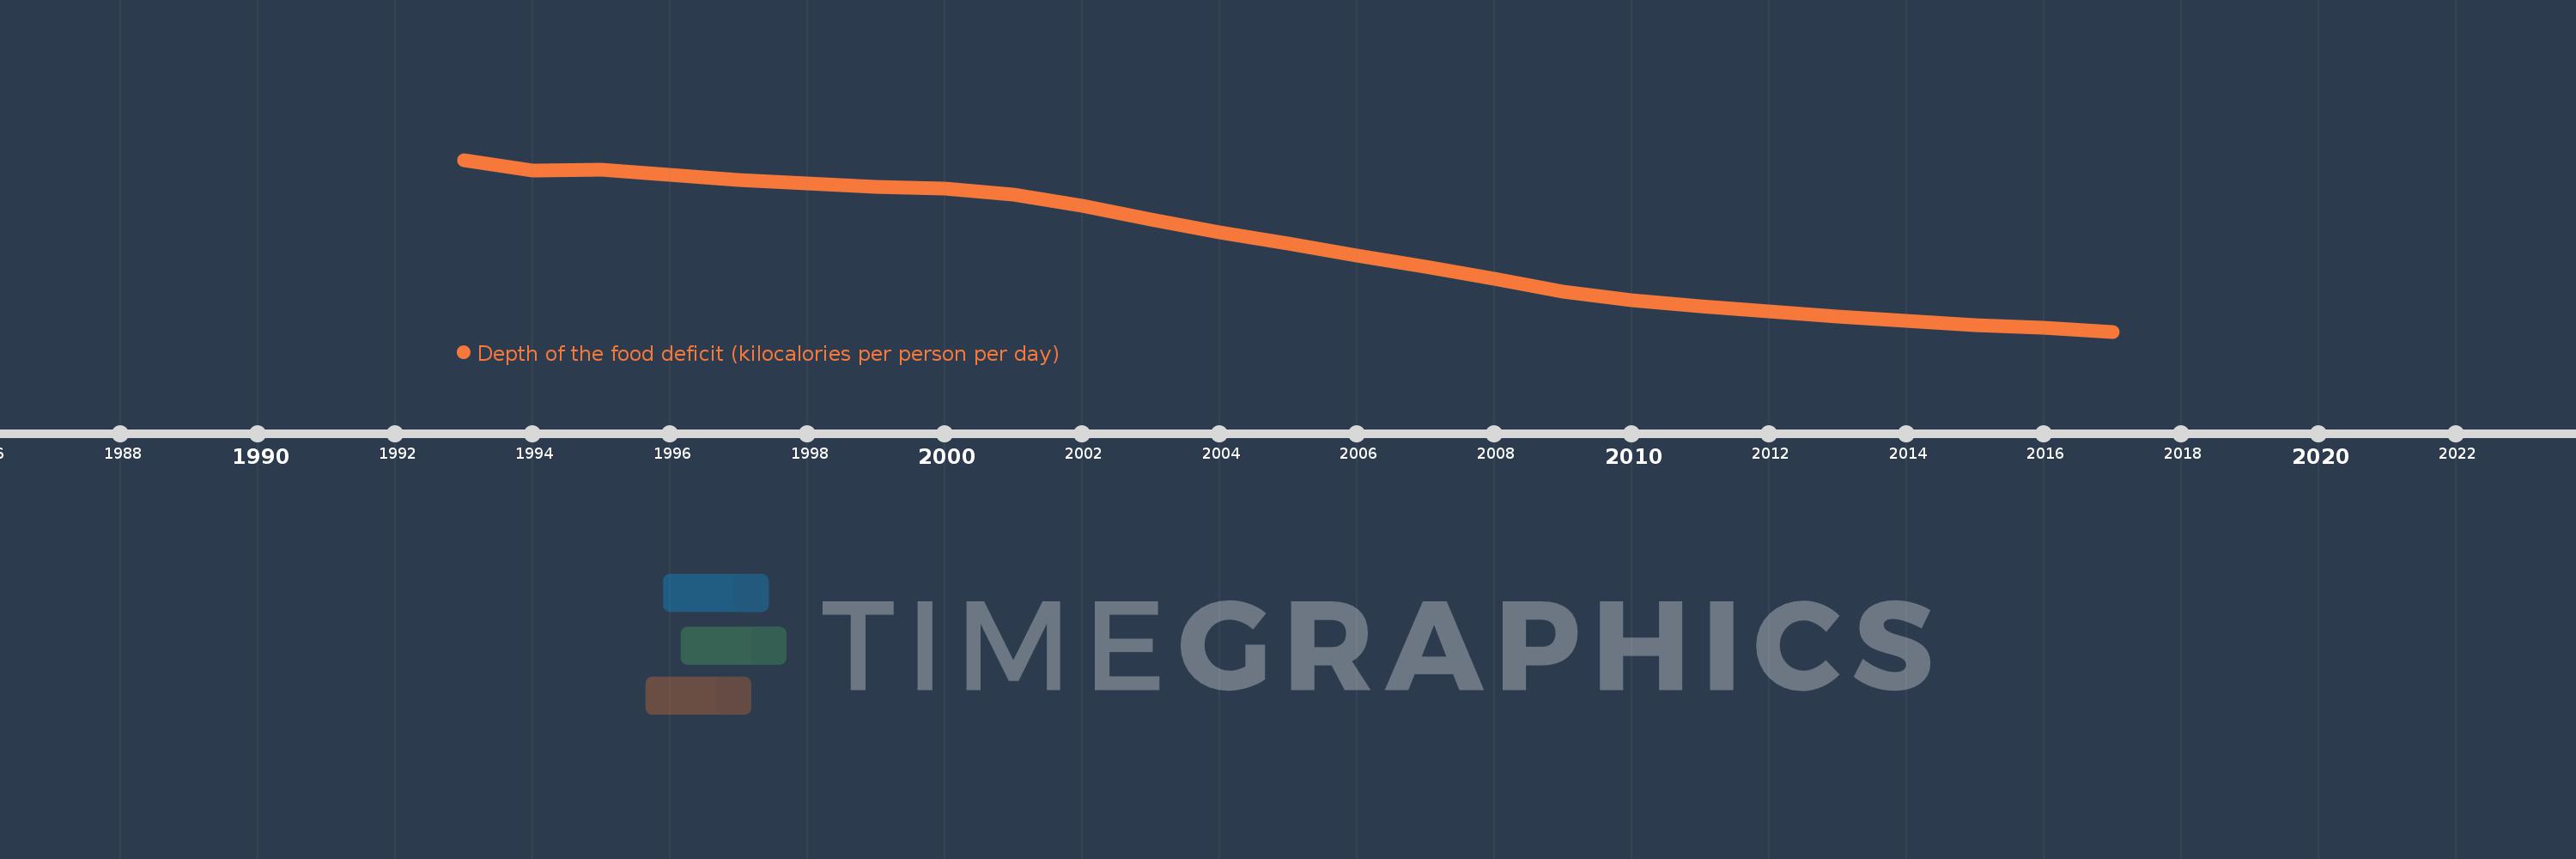
Depth of the food deficit (kilocalories per person per day)
2017,2016,2015,2014,2013,2012,2011,2010,2009,2008,2007,2006,2005,2004,2003,2002,2001,2000,1999,1998,1997,1996,1995,1994,1993
Estas estatísticas em outros países:
Linha do tempo:
Nesta escala de tempo está apresentado um gráfico de 1993 ano até 2017 ano Latin America & Caribbean . Dados de 1992 ano ausente. O número de observações reais por data: 25.
Fonte (nome):
Indicadores de desenvolvimento mundial
Fonte (organização):
Food and Agriculture Organization, Food Security Statistics.
Categorias:
Health
Foi atualizado:
23 abr 2017 ano
Indicadores de alterações dos valores ao longo dos anos
Mínimo:
39.954
1 jan 2017 ano
Máximo:
105.285
1 jan 1993 ano
Na data de observação
Valor
Mudança absoluta
A alteração em relação ao valor anterior
1 jan 1993 ano
105.285
+105.285
0.0%
1 jan 1994 ano
101.325
-3.961
-3.76%
1 jan 1995 ano
101.371
+0.046
0.05%
1 jan 1996 ano
99.409
-1.963
-1.94%
1 jan 1997 ano
97.668
-1.741
-1.75%
1 jan 1998 ano
96.385
-1.282
-1.31%
1 jan 1999 ano
95.075
-1.31
-1.36%
1 jan 2000 ano
94.343
-0.732
-0.77%
1 jan 2001 ano
91.947
-2.396
-2.54%
1 jan 2002 ano
87.764
-4.183
-4.55%
1 jan 2003 ano
82.553
-5.212
-5.94%
1 jan 2004 ano
77.76
-4.793
-5.81%
1 jan 2005 ano
73.56
-4.199
-5.4%
1 jan 2006 ano
68.975
-4.585
-6.23%
1 jan 2007 ano
64.628
-4.347
-6.3%
1 jan 2008 ano
60.011
-4.617
-7.14%
1 jan 2009 ano
55.266
-4.745
-7.91%
1 jan 2010 ano
51.903
-3.363
-6.08%
1 jan 2011 ano
49.529
-2.374
-4.57%
1 jan 2012 ano
47.718
-1.811
-3.66%
1 jan 2013 ano
45.782
-1.936
-4.06%
1 jan 2014 ano
44.0
-1.782
-3.89%
1 jan 2015 ano
42.34
-1.66
-3.77%
1 jan 2016 ano
41.288
-1.052
-2.48%
1 jan 2017 ano
39.954
-1.334
-3.23%
Classificação de países por estatísticas atuais por anos


Comentários: