29
/pt/
pt
AIzaSyAYiBZKx7MnpbEhh9jyipgxe19OcubqV5w
April 1, 2024
264446
Togo
TGO
true
2
1
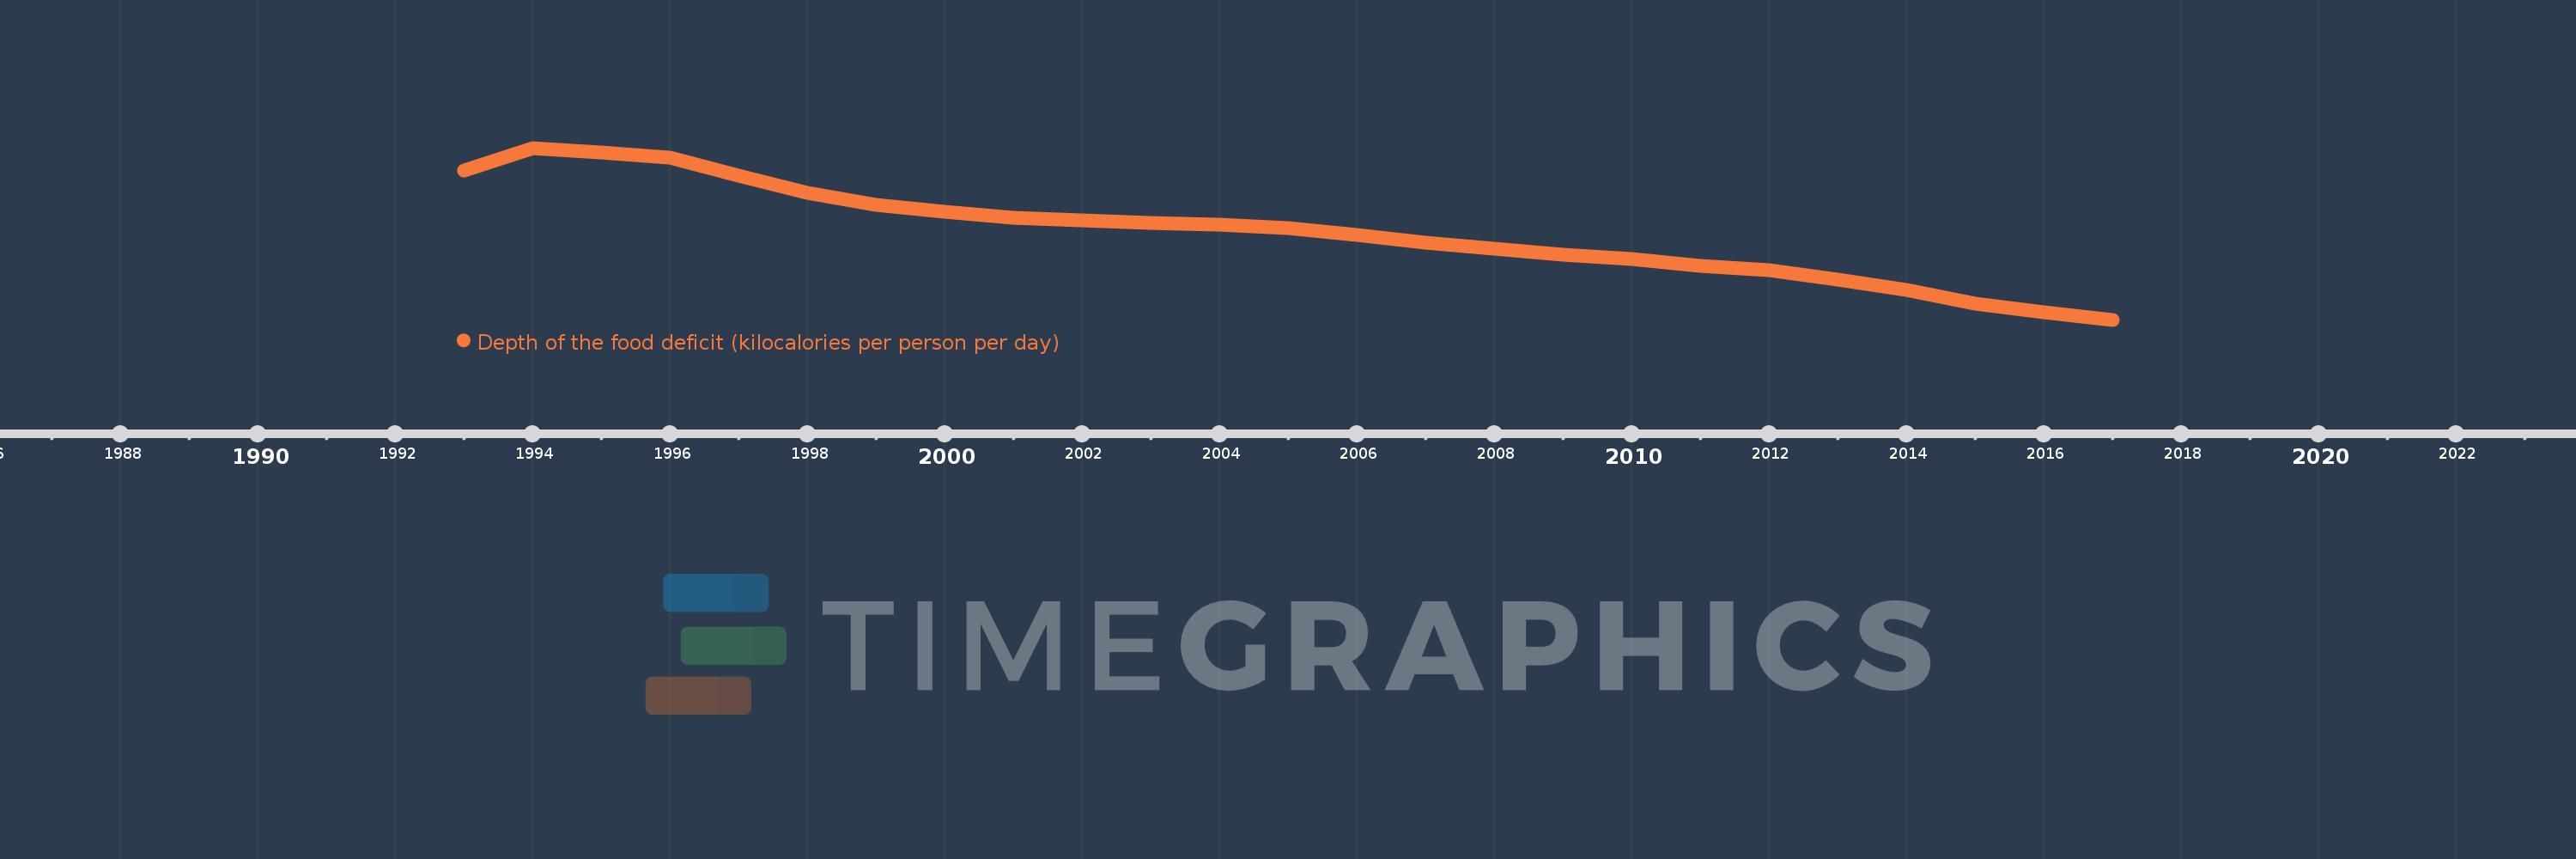
Depth of the food deficit (kilocalories per person per day)
2017,2016,2015,2014,2013,2012,2011,2010,2009,2008,2007,2006,2005,2004,2003,2002,2001,2000,1999,1998,1997,1996,1995,1994,1993
Estas estatísticas em outros países:
Linha do tempo:
Nesta escala de tempo está apresentado um gráfico de 1993 ano até 2017 ano Togo. Dados de 1992 ano ausente. O número de observações reais por data: 25.
Fonte (nome):
Indicadores de desenvolvimento mundial
Fonte (organização):
Food and Agriculture Organization, Food Security Statistics.
Categorias:
Health
Foi atualizado:
23 abr 2017 ano
Indicadores de alterações dos valores ao longo dos anos
Mínimo:
75.0
1 jan 2017 ano
Máximo:
297.0
1 jan 1994 ano
Na data de observação
Valor
Mudança absoluta
A alteração em relação ao valor anterior
1 jan 1993 ano
268.0
+268.0
0.0%
1 jan 1994 ano
297.0
+29.0
10.82%
1 jan 1995 ano
291.0
-6.0
-2.02%
1 jan 1996 ano
284.0
-7.0
-2.41%
1 jan 1997 ano
261.0
-23.0
-8.1%
1 jan 1998 ano
239.0
-22.0
-8.43%
1 jan 1999 ano
223.0
-16.0
-6.69%
1 jan 2000 ano
214.0
-9.0
-4.04%
1 jan 2001 ano
207.0
-7.0
-3.27%
1 jan 2002 ano
203.0
-4.0
-1.93%
1 jan 2003 ano
200.0
-3.0
-1.48%
1 jan 2004 ano
198.0
-2.0
-1.0%
1 jan 2005 ano
193.0
-5.0
-2.53%
1 jan 2006 ano
185.0
-8.0
-4.15%
1 jan 2007 ano
175.0
-10.0
-5.41%
1 jan 2008 ano
167.0
-8.0
-4.57%
1 jan 2009 ano
159.0
-8.0
-4.79%
1 jan 2010 ano
153.0
-6.0
-3.77%
1 jan 2011 ano
145.0
-8.0
-5.23%
1 jan 2012 ano
139.0
-6.0
-4.14%
1 jan 2013 ano
127.0
-12.0
-8.63%
1 jan 2014 ano
114.0
-13.0
-10.24%
1 jan 2015 ano
96.0
-18.0
-15.79%
1 jan 2016 ano
85.0
-11.0
-11.46%
1 jan 2017 ano
75.0
-10.0
-11.76%
Classificação de países por estatísticas atuais por anos


Comentários: