29
/pt/
pt
AIzaSyAYiBZKx7MnpbEhh9jyipgxe19OcubqV5w
April 1, 2024
74831
Azerbaijan
AZE
true
2
1
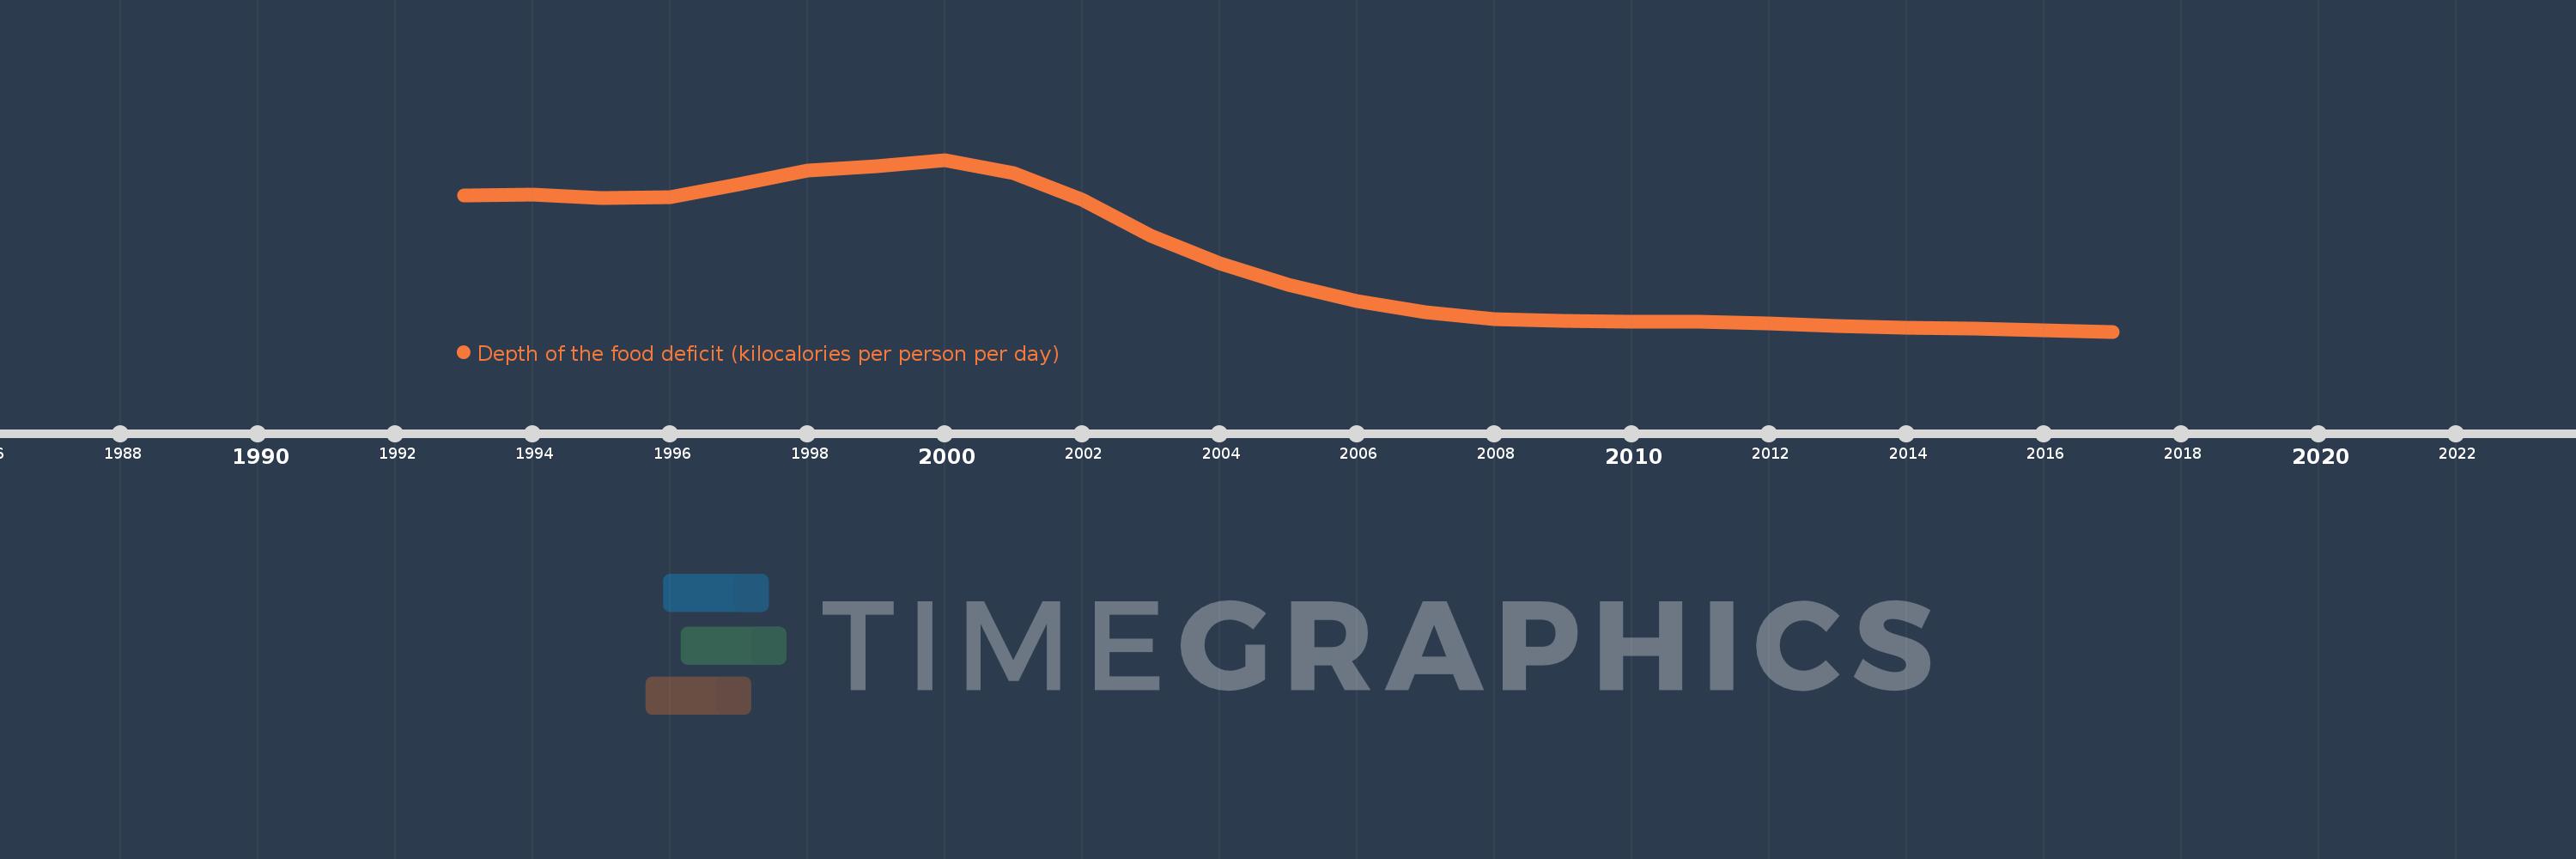
Depth of the food deficit (kilocalories per person per day)
2017,2016,2015,2014,2013,2012,2011,2010,2009,2008,2007,2006,2005,2004,2003,2002,2001,2000,1999,1998,1997,1996,1995,1994,1993
Estas estatísticas em outros países:
Linha do tempo:
Nesta escala de tempo está apresentado um gráfico de 1993 ano até 2017 ano Azerbaijan. Dados de 1992 ano ausente. O número de observações reais por data: 25.
Fonte (nome):
Indicadores de desenvolvimento mundial
Fonte (organização):
Food and Agriculture Organization, Food Security Statistics.
Categorias:
Health
Foi atualizado:
23 abr 2017 ano
Indicadores de alterações dos valores ao longo dos anos
Mínimo:
12.0
1 jan 2017 ano
Máximo:
202.0
1 jan 2000 ano
Na data de observação
Valor
Mudança absoluta
A alteração em relação ao valor anterior
1 jan 1993 ano
163.0
+163.0
0.0%
1 jan 1994 ano
164.0
+1.0
0.61%
1 jan 1995 ano
160.0
-4.0
-2.44%
1 jan 1996 ano
161.0
+1.0
0.63%
1 jan 1997 ano
175.0
+14.0
8.7%
1 jan 1998 ano
190.0
+15.0
8.57%
1 jan 1999 ano
195.0
+5.0
2.63%
1 jan 2000 ano
202.0
+7.0
3.59%
1 jan 2001 ano
187.0
-15.0
-7.43%
1 jan 2002 ano
158.0
-29.0
-15.51%
1 jan 2003 ano
118.0
-40.0
-25.32%
1 jan 2004 ano
88.0
-30.0
-25.42%
1 jan 2005 ano
64.0
-24.0
-27.27%
1 jan 2006 ano
46.0
-18.0
-28.13%
1 jan 2007 ano
33.0
-13.0
-28.26%
1 jan 2008 ano
26.0
-7.0
-21.21%
1 jan 2009 ano
24.0
-2.0
-7.69%
1 jan 2010 ano
23.0
-1.0
-4.17%
1 jan 2011 ano
23.0
0.0
0.0%
1 jan 2012 ano
21.0
-2.0
-8.7%
1 jan 2013 ano
18.0
-3.0
-14.29%
1 jan 2014 ano
16.0
-2.0
-11.11%
1 jan 2015 ano
15.0
-1.0
-6.25%
1 jan 2016 ano
13.0
-2.0
-13.33%
1 jan 2017 ano
12.0
-1.0
-7.69%
Classificação de países por estatísticas atuais por anos


Comentários: