29
/pt/
pt
AIzaSyAYiBZKx7MnpbEhh9jyipgxe19OcubqV5w
April 1, 2024
186363
Malawi
MWI
true
2
1
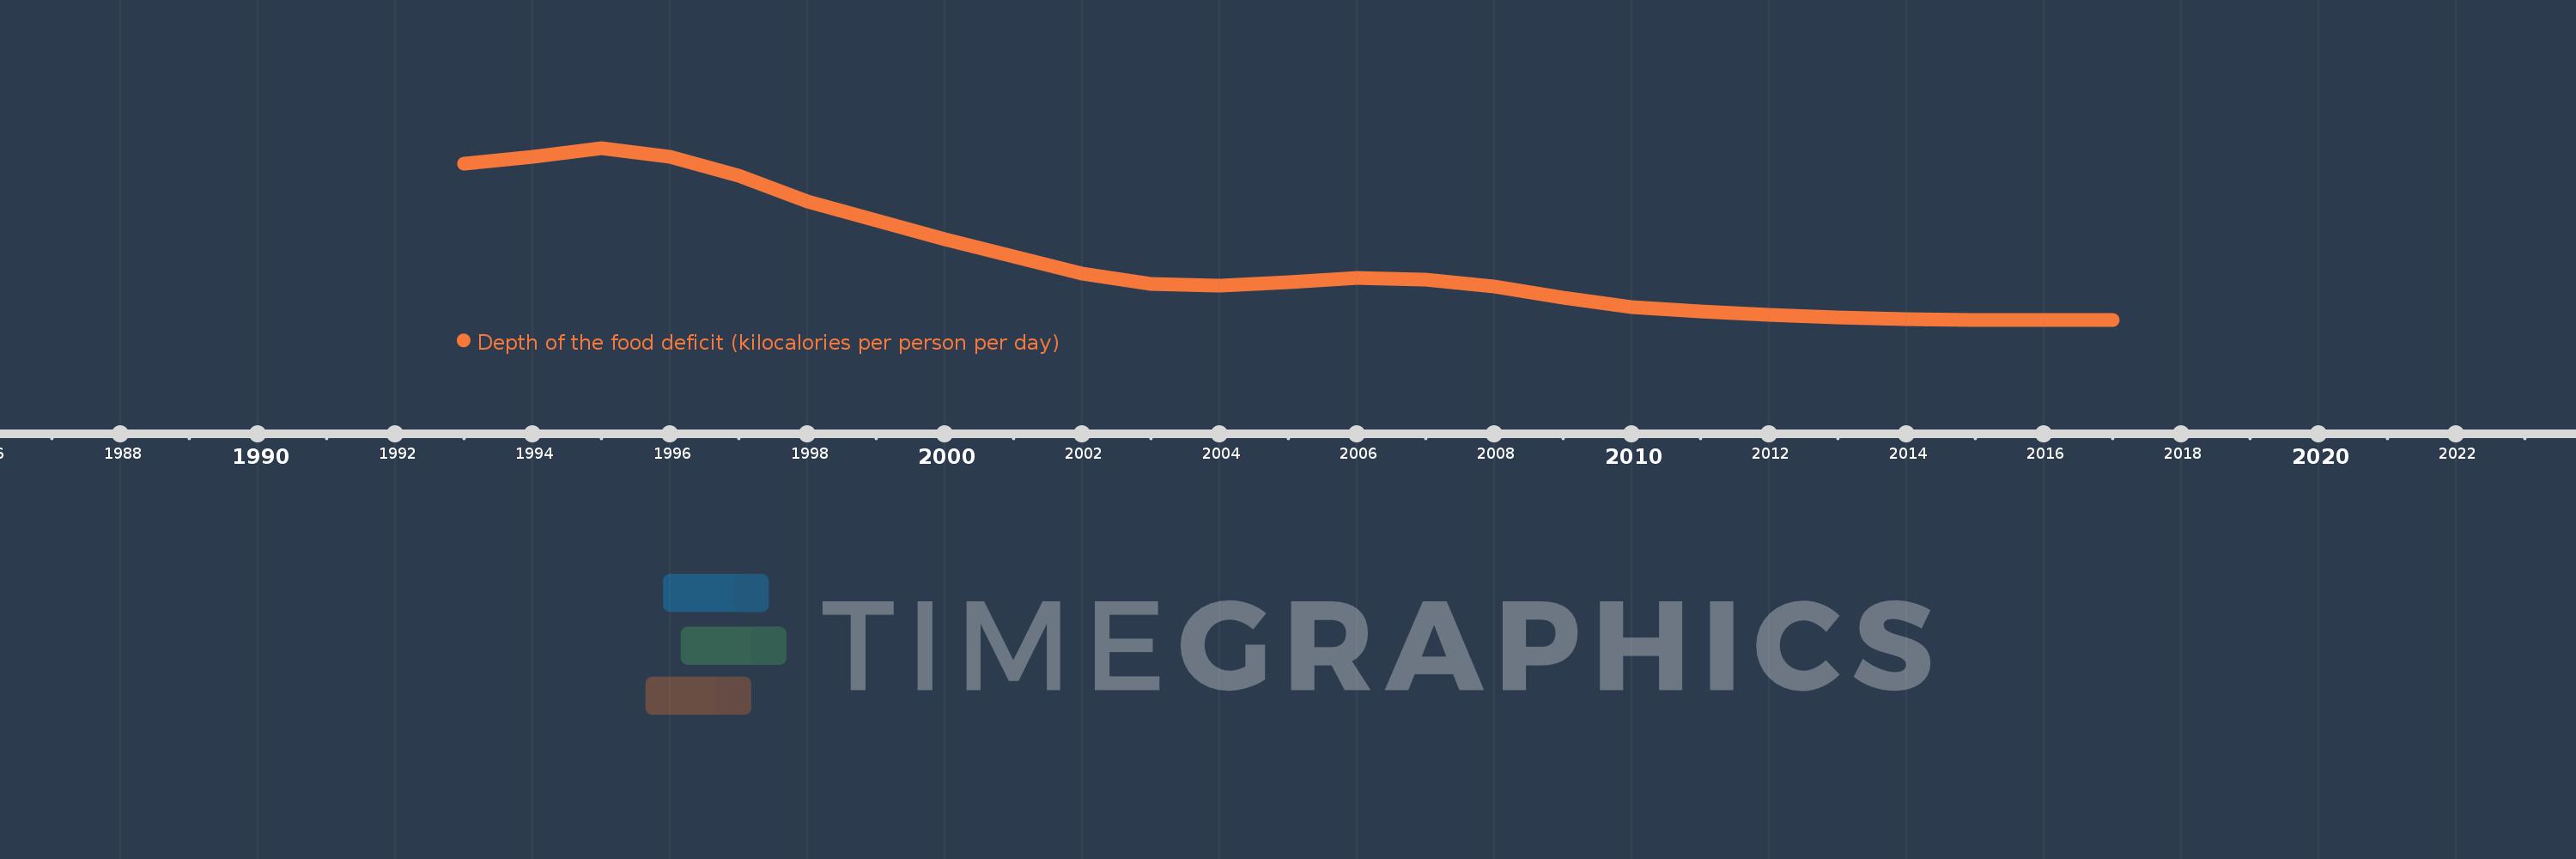
Depth of the food deficit (kilocalories per person per day)
2017,2016,2015,2014,2013,2012,2011,2010,2009,2008,2007,2006,2005,2004,2003,2002,2001,2000,1999,1998,1997,1996,1995,1994,1993
Estas estatísticas em outros países:
Linha do tempo:
Nesta escala de tempo está apresentado um gráfico de 1993 ano até 2017 ano Malawi. Dados de 1992 ano ausente. O número de observações reais por data: 25.
Fonte (nome):
Indicadores de desenvolvimento mundial
Fonte (organização):
Food and Agriculture Organization, Food Security Statistics.
Categorias:
Health
Foi atualizado:
23 abr 2017 ano
Indicadores de alterações dos valores ao longo dos anos
Mínimo:
139.0
1 jan 2015 ano
Máximo:
352.0
1 jan 1995 ano
Na data de observação
Valor
Mudança absoluta
A alteração em relação ao valor anterior
1 jan 1993 ano
332.0
+332.0
0.0%
1 jan 1994 ano
341.0
+9.0
2.71%
1 jan 1995 ano
352.0
+11.0
3.23%
1 jan 1996 ano
341.0
-11.0
-3.13%
1 jan 1997 ano
318.0
-23.0
-6.74%
1 jan 1998 ano
286.0
-32.0
-10.06%
1 jan 1999 ano
262.0
-24.0
-8.39%
1 jan 2000 ano
239.0
-23.0
-8.78%
1 jan 2001 ano
217.0
-22.0
-9.21%
1 jan 2002 ano
196.0
-21.0
-9.68%
1 jan 2003 ano
183.0
-13.0
-6.63%
1 jan 2004 ano
181.0
-2.0
-1.09%
1 jan 2005 ano
186.0
+5.0
2.76%
1 jan 2006 ano
191.0
+5.0
2.69%
1 jan 2007 ano
189.0
-2.0
-1.05%
1 jan 2008 ano
180.0
-9.0
-4.76%
1 jan 2009 ano
166.0
-14.0
-7.78%
1 jan 2010 ano
155.0
-11.0
-6.63%
1 jan 2011 ano
149.0
-6.0
-3.87%
1 jan 2012 ano
145.0
-4.0
-2.68%
1 jan 2013 ano
142.0
-3.0
-2.07%
1 jan 2014 ano
140.0
-2.0
-1.41%
1 jan 2015 ano
139.0
-1.0
-0.71%
1 jan 2016 ano
139.0
0.0
0.0%
1 jan 2017 ano
139.0
0.0
0.0%
Classificação de países por estatísticas atuais por anos


Comentários: