29
/pt/
pt
AIzaSyAYiBZKx7MnpbEhh9jyipgxe19OcubqV5w
April 1, 2024
24793
Caribbean small states
CSS
false
2
1
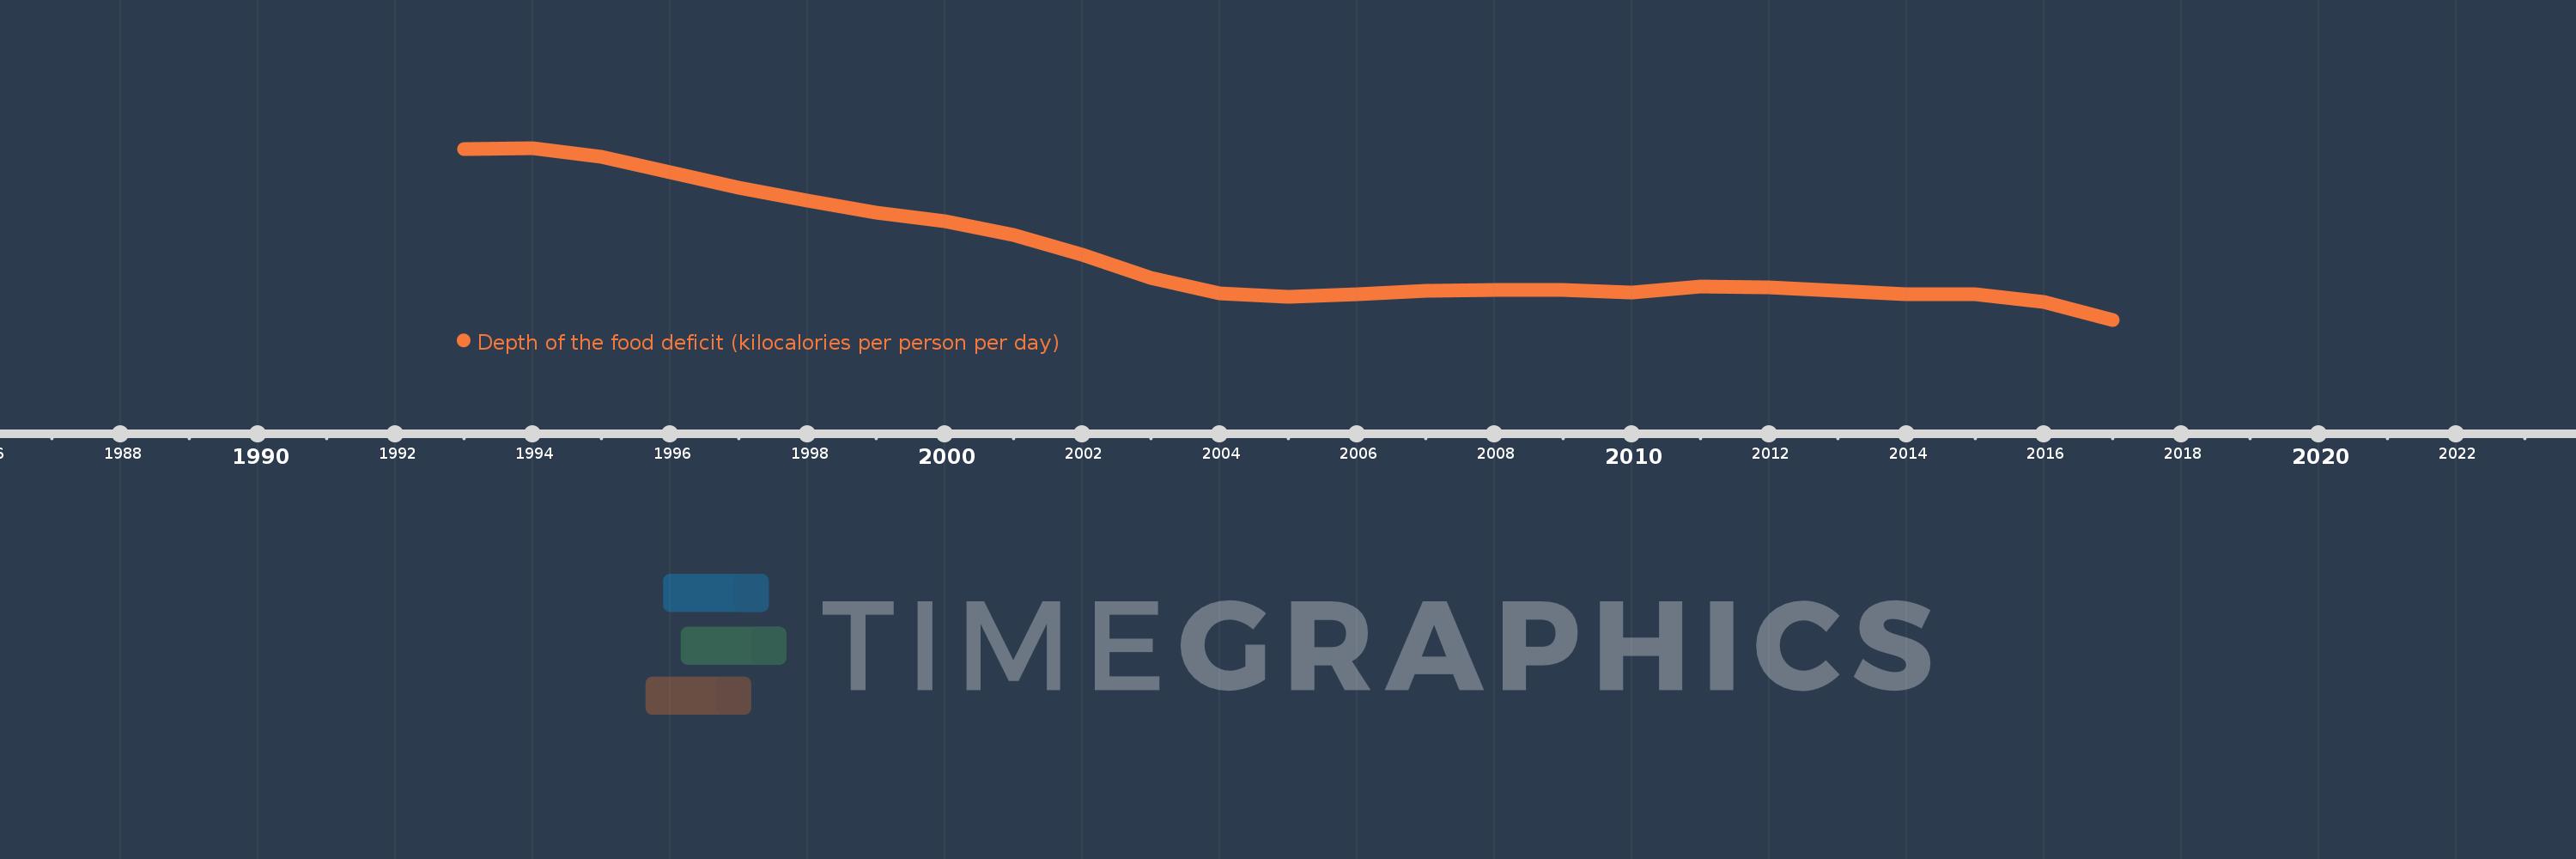
Depth of the food deficit (kilocalories per person per day)
2017,2016,2015,2014,2013,2012,2011,2010,2009,2008,2007,2006,2005,2004,2003,2002,2001,2000,1999,1998,1997,1996,1995,1994,1993
Estas estatísticas em outros países:
Linha do tempo:
Nesta escala de tempo está apresentado um gráfico de 1993 ano até 2017 ano Caribbean small states. Dados de 1992 ano ausente. O número de observações reais por data: 25.
Fonte (nome):
Indicadores de desenvolvimento mundial
Fonte (organização):
Food and Agriculture Organization, Food Security Statistics.
Categorias:
Health
Foi atualizado:
23 abr 2017 ano
Indicadores de alterações dos valores ao longo dos anos
Mínimo:
56.15
1 jan 2017 ano
Máximo:
88.599
1 jan 1994 ano
Na data de observação
Valor
Mudança absoluta
A alteração em relação ao valor anterior
1 jan 1993 ano
88.346
+88.346
0.0%
1 jan 1994 ano
88.599
+0.253
0.29%
1 jan 1995 ano
86.903
-1.696
-1.91%
1 jan 1996 ano
84.059
-2.844
-3.27%
1 jan 1997 ano
81.086
-2.973
-3.54%
1 jan 1998 ano
78.671
-2.415
-2.98%
1 jan 1999 ano
76.339
-2.332
-2.96%
1 jan 2000 ano
74.833
-1.507
-1.97%
1 jan 2001 ano
72.164
-2.668
-3.57%
1 jan 2002 ano
68.489
-3.675
-5.09%
1 jan 2003 ano
64.128
-4.361
-6.37%
1 jan 2004 ano
61.196
-2.932
-4.57%
1 jan 2005 ano
60.463
-0.733
-1.2%
1 jan 2006 ano
61.007
+0.544
0.9%
1 jan 2007 ano
61.641
+0.633
1.04%
1 jan 2008 ano
61.849
+0.208
0.34%
1 jan 2009 ano
61.705
-0.144
-0.23%
1 jan 2010 ano
61.334
-0.371
-0.6%
1 jan 2011 ano
62.385
+1.05
1.71%
1 jan 2012 ano
62.203
-0.182
-0.29%
1 jan 2013 ano
61.596
-0.607
-0.98%
1 jan 2014 ano
61.008
-0.588
-0.95%
1 jan 2015 ano
60.991
-0.017
-0.03%
1 jan 2016 ano
59.54
-1.451
-2.38%
1 jan 2017 ano
56.15
-3.39
-5.69%
Classificação de países por estatísticas atuais por anos


Comentários: