29
/pt/
pt
AIzaSyAYiBZKx7MnpbEhh9jyipgxe19OcubqV5w
April 1, 2024
165987
Kazakhstan
KAZ
true
2
1
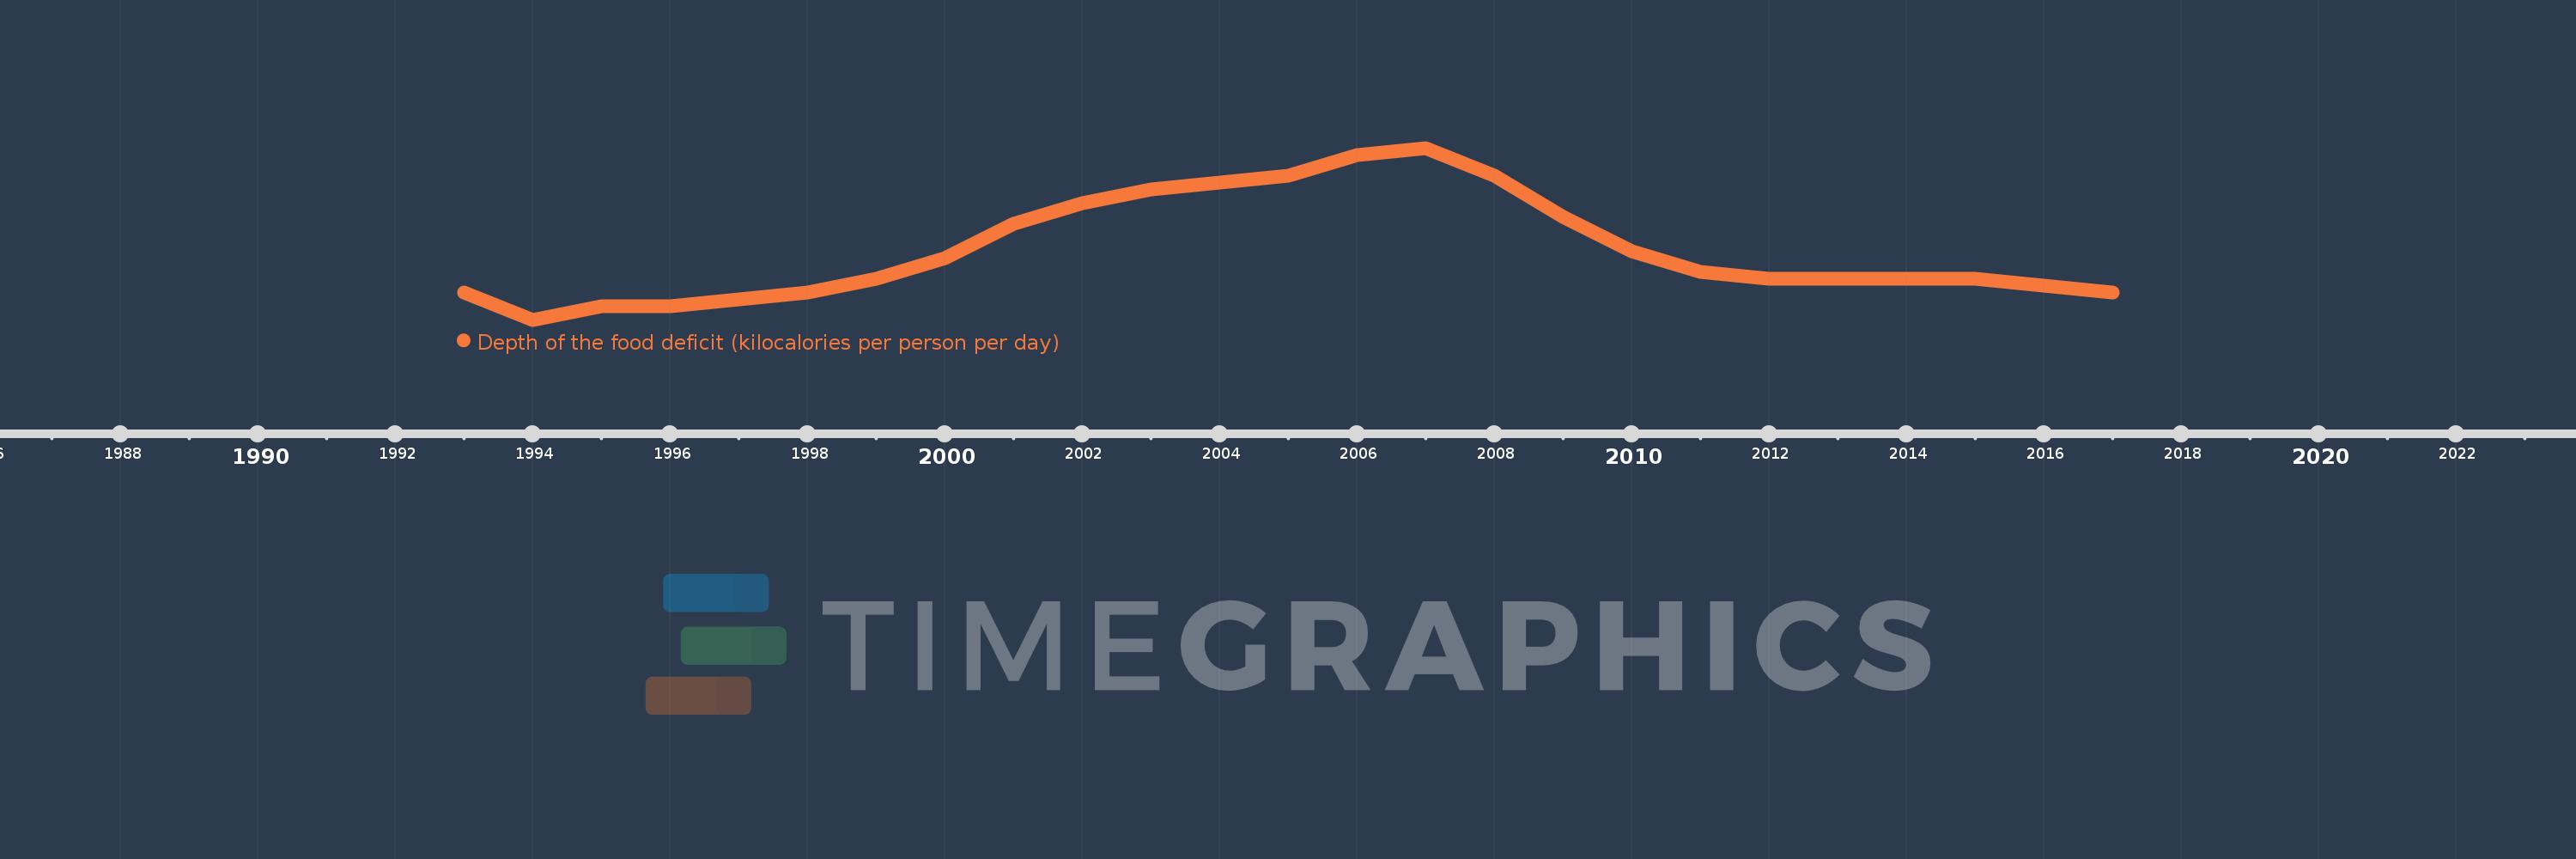
Depth of the food deficit (kilocalories per person per day)
2017,2016,2015,2014,2013,2012,2011,2010,2009,2008,2007,2006,2005,2004,2003,2002,2001,2000,1999,1998,1997,1996,1995,1994,1993
Estas estatísticas em outros países:
Linha do tempo:
Nesta escala de tempo está apresentado um gráfico de 1993 ano até 2017 ano Kazakhstan. Dados de 1992 ano ausente. O número de observações reais por data: 25.
Fonte (nome):
Indicadores de desenvolvimento mundial
Fonte (organização):
Food and Agriculture Organization, Food Security Statistics.
Categorias:
Health
Foi atualizado:
23 abr 2017 ano
Indicadores de alterações dos valores ao longo dos anos
Mínimo:
14.0
1 jan 1994 ano
Máximo:
39.0
1 jan 2007 ano
Na data de observação
Valor
Mudança absoluta
A alteração em relação ao valor anterior
1 jan 1993 ano
18.0
+18.0
0.0%
1 jan 1994 ano
14.0
-4.0
-22.22%
1 jan 1995 ano
16.0
+2.0
14.29%
1 jan 1996 ano
16.0
0.0
0.0%
1 jan 1997 ano
17.0
+1.0
6.25%
1 jan 1998 ano
18.0
+1.0
5.88%
1 jan 1999 ano
20.0
+2.0
11.11%
1 jan 2000 ano
23.0
+3.0
15.0%
1 jan 2001 ano
28.0
+5.0
21.74%
1 jan 2002 ano
31.0
+3.0
10.71%
1 jan 2003 ano
33.0
+2.0
6.45%
1 jan 2004 ano
34.0
+1.0
3.03%
1 jan 2005 ano
35.0
+1.0
2.94%
1 jan 2006 ano
38.0
+3.0
8.57%
1 jan 2007 ano
39.0
+1.0
2.63%
1 jan 2008 ano
35.0
-4.0
-10.26%
1 jan 2009 ano
29.0
-6.0
-17.14%
1 jan 2010 ano
24.0
-5.0
-17.24%
1 jan 2011 ano
21.0
-3.0
-12.5%
1 jan 2012 ano
20.0
-1.0
-4.76%
1 jan 2013 ano
20.0
0.0
0.0%
1 jan 2014 ano
20.0
0.0
0.0%
1 jan 2015 ano
20.0
0.0
0.0%
1 jan 2016 ano
19.0
-1.0
-5.0%
1 jan 2017 ano
18.0
-1.0
-5.26%
Classificação de países por estatísticas atuais por anos


Comentários: