29
/pt/
pt
AIzaSyAYiBZKx7MnpbEhh9jyipgxe19OcubqV5w
April 1, 2024
27186
East Asia & Pacific
EAS
false
2
1
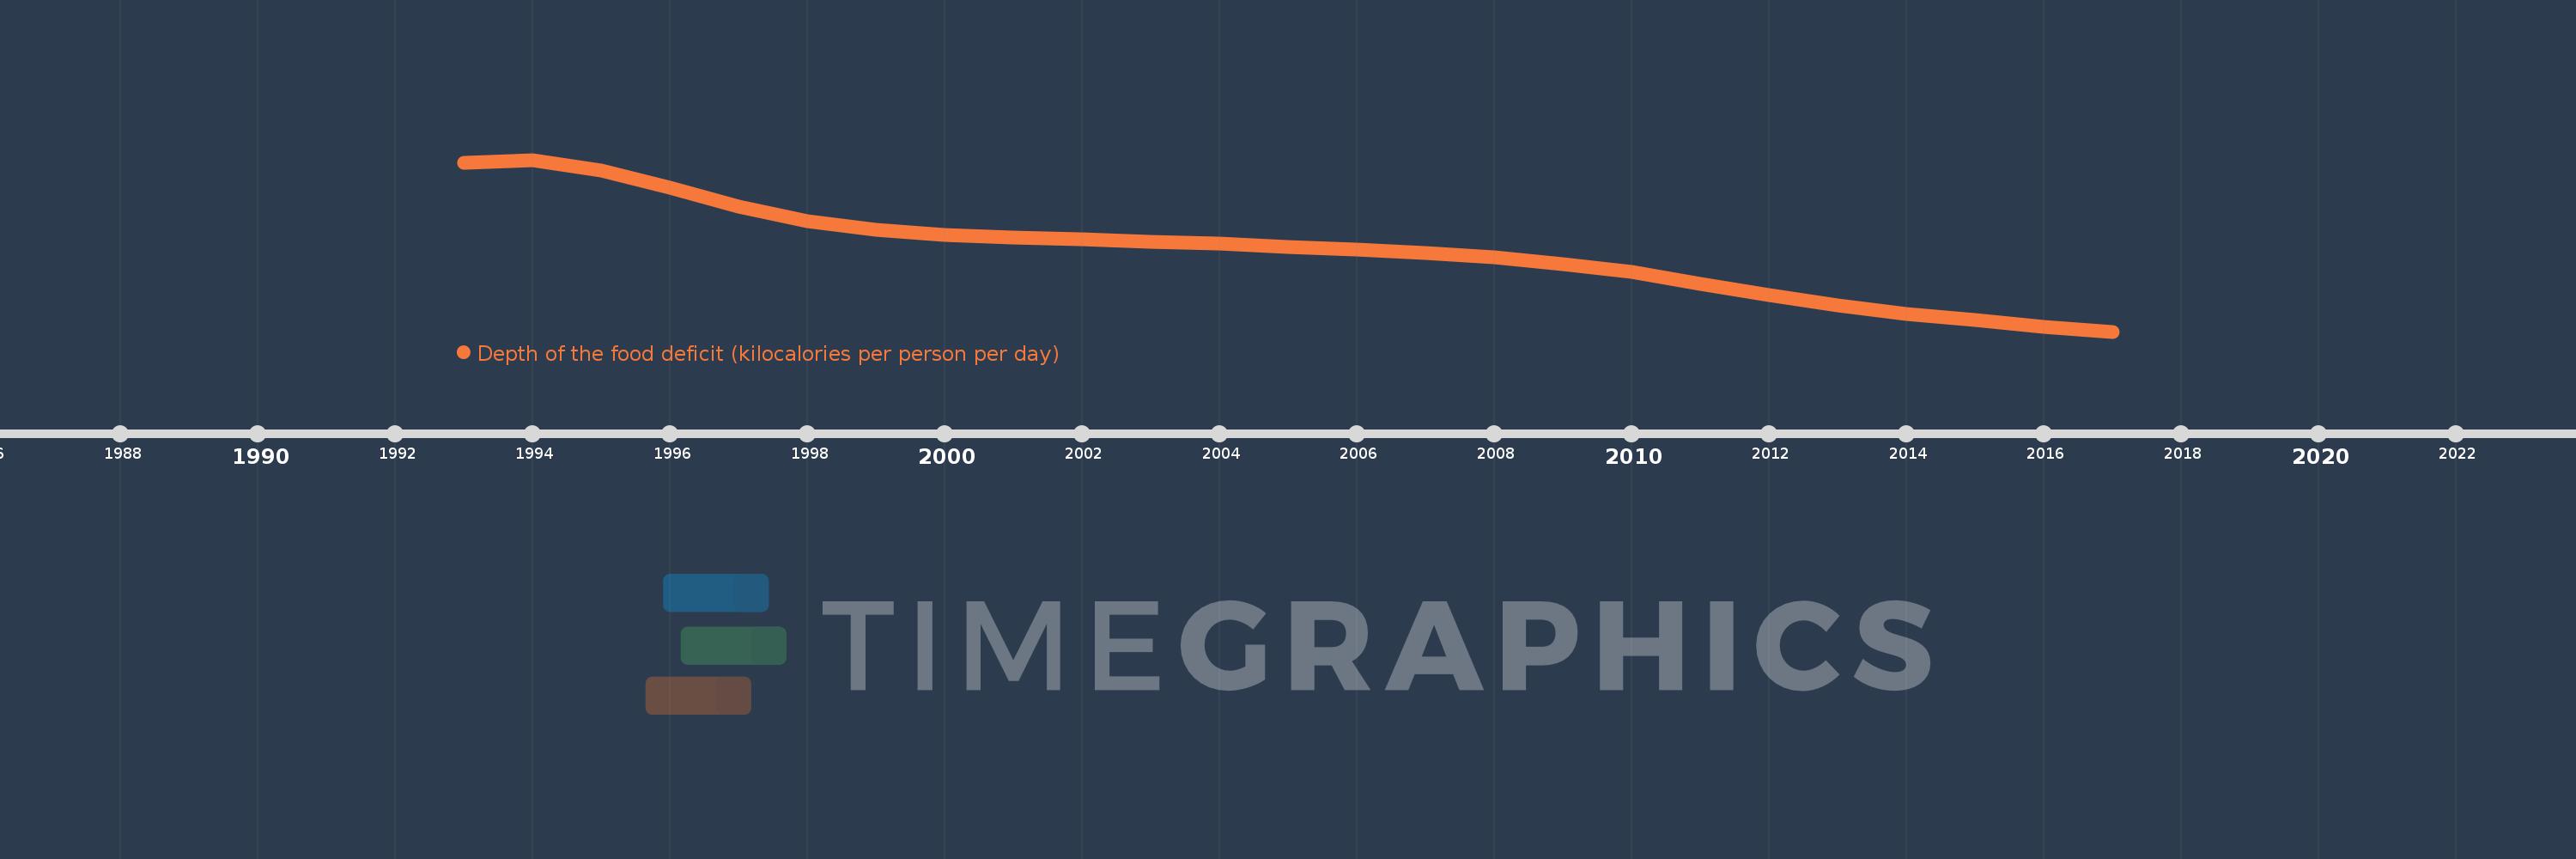
Depth of the food deficit (kilocalories per person per day)
2017,2016,2015,2014,2013,2012,2011,2010,2009,2008,2007,2006,2005,2004,2003,2002,2001,2000,1999,1998,1997,1996,1995,1994,1993
Estas estatísticas em outros países:
Linha do tempo:
Nesta escala de tempo está apresentado um gráfico de 1993 ano até 2017 ano East Asia & Pacific. Dados de 1992 ano ausente. O número de observações reais por data: 25.
Fonte (nome):
Indicadores de desenvolvimento mundial
Fonte (organização):
Food and Agriculture Organization, Food Security Statistics.
Categorias:
Health
Foi atualizado:
23 abr 2017 ano
Indicadores de alterações dos valores ao longo dos anos
Mínimo:
73.693
1 jan 2017 ano
Máximo:
195.003
1 jan 1994 ano
Na data de observação
Valor
Mudança absoluta
A alteração em relação ao valor anterior
1 jan 1993 ano
192.72
+192.72
0.0%
1 jan 1994 ano
195.003
+2.284
1.18%
1 jan 1995 ano
187.333
-7.67
-3.93%
1 jan 1996 ano
175.431
-11.902
-6.35%
1 jan 1997 ano
162.129
-13.302
-7.58%
1 jan 1998 ano
151.765
-10.364
-6.39%
1 jan 1999 ano
145.765
-6.0
-3.95%
1 jan 2000 ano
142.189
-3.576
-2.45%
1 jan 2001 ano
140.176
-2.012
-1.42%
1 jan 2002 ano
138.881
-1.295
-0.92%
1 jan 2003 ano
136.912
-1.97
-1.42%
1 jan 2004 ano
135.567
-1.344
-0.98%
1 jan 2005 ano
133.562
-2.006
-1.48%
1 jan 2006 ano
131.687
-1.874
-1.4%
1 jan 2007 ano
129.338
-2.349
-1.78%
1 jan 2008 ano
126.414
-2.923
-2.26%
1 jan 2009 ano
121.449
-4.966
-3.93%
1 jan 2010 ano
115.926
-5.522
-4.55%
1 jan 2011 ano
107.355
-8.572
-7.39%
1 jan 2012 ano
99.47
-7.884
-7.34%
1 jan 2013 ano
91.952
-7.518
-7.56%
1 jan 2014 ano
85.947
-6.005
-6.53%
1 jan 2015 ano
81.607
-4.34
-5.05%
1 jan 2016 ano
77.124
-4.483
-5.49%
1 jan 2017 ano
73.693
-3.431
-4.45%
Classificação de países por estatísticas atuais por anos


Comentários: