29
/
en
AIzaSyAYiBZKx7MnpbEhh9jyipgxe19OcubqV5w
April 1, 2024
257366
Switzerland
CHE
true
2
1
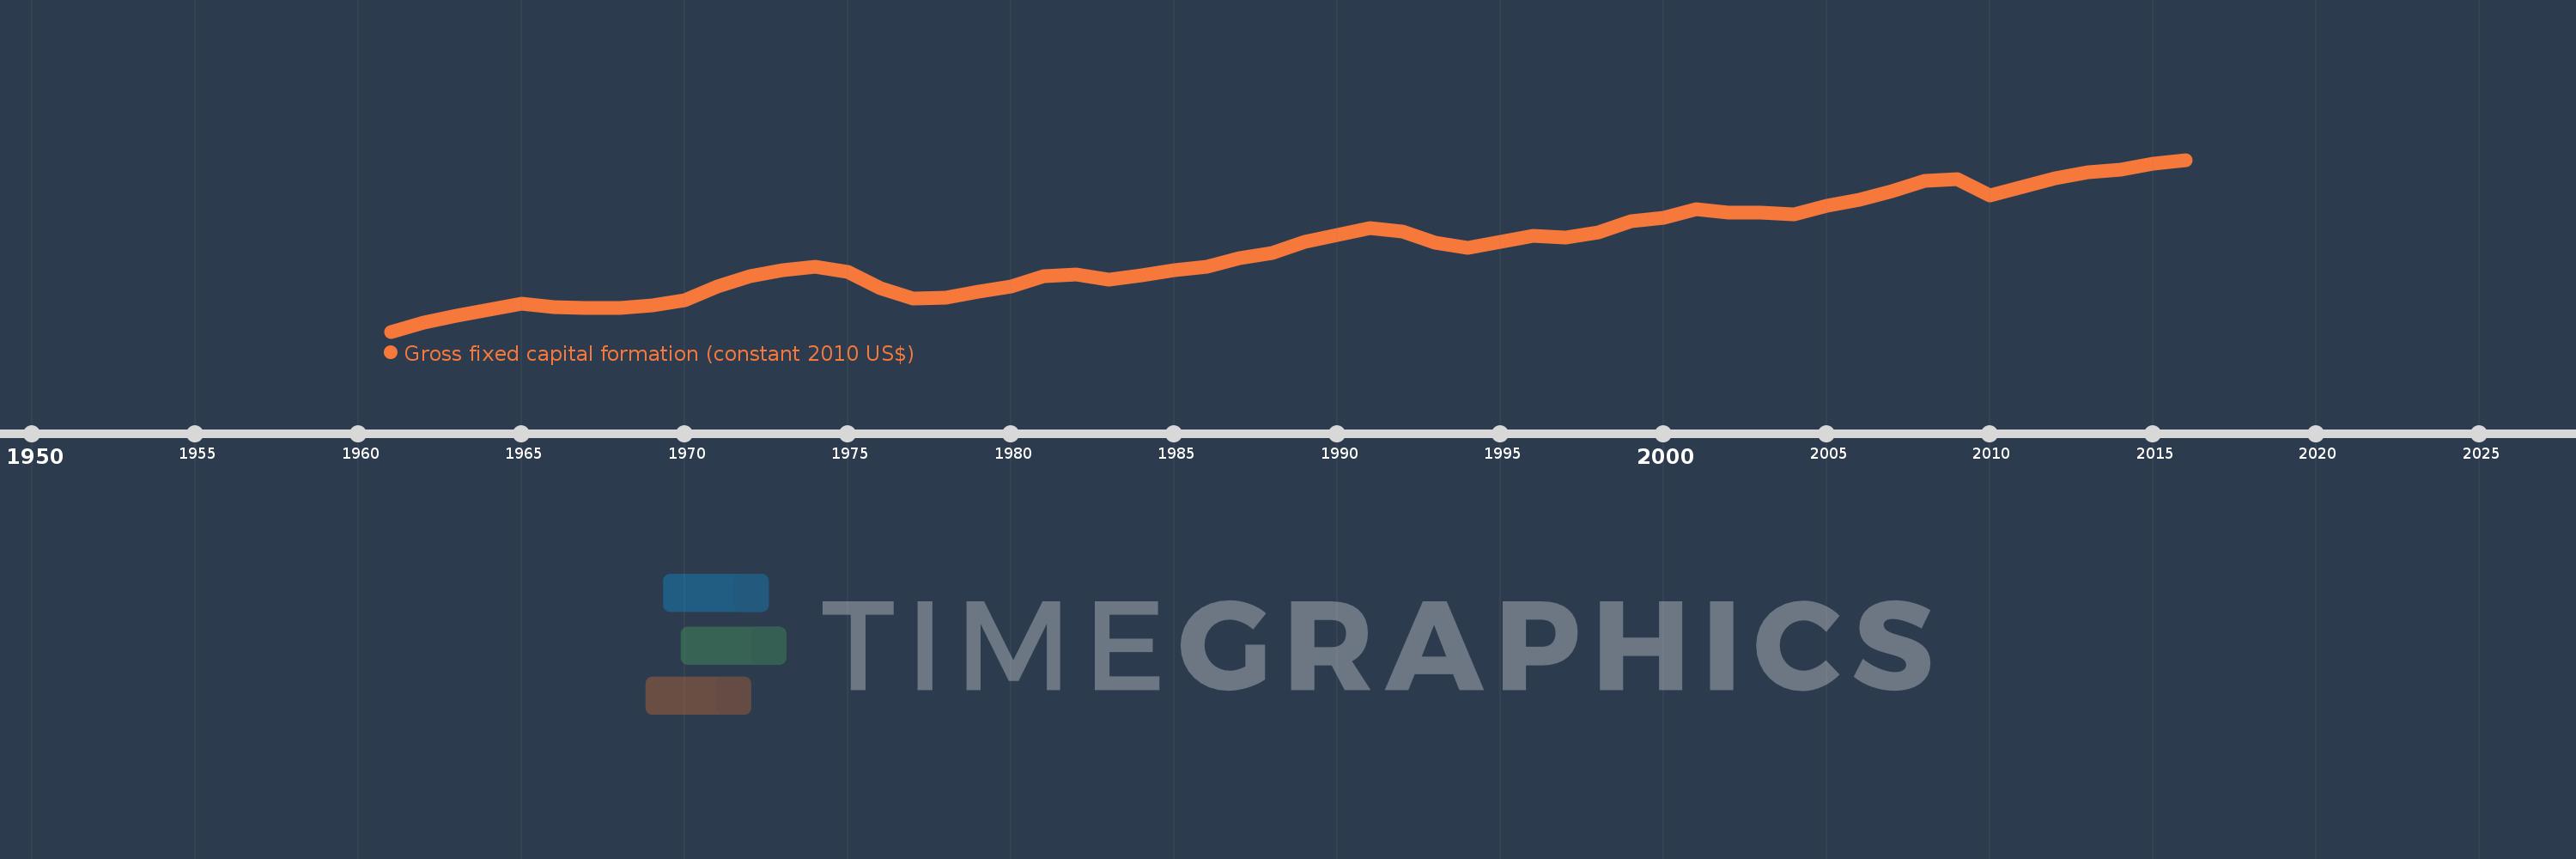
Gross fixed capital formation (constant 2010 US$)
2016,2015,2014,2013,2012,2011,2010,2009,2008,2007,2006,2005,2004,2003,2002,2001,2000,1999,1998,1997,1996,1995,1994,1993,1992,1991,1990,1989,1988,1987,1986,1985,1984,1983,1982,1981,1980,1979,1978,1977,1976,1975,1974,1973,1972,1971,1970,1969,1968,1967,1966,1965,1964,1963,1962,1961
This statistics in other country:
AfghanistanAlbaniaAlgeriaAngolaAntigua and BarbudaArab WorldArgentinaArmeniaAustraliaAustriaAzerbaijanBahamas, TheBahrainBangladeshBarbadosBelarusBelgiumBelizeBeninBermudaBhutanBoliviaBosnia and HerzegovinaBotswanaBrazilBrunei DarussalamBulgariaBurkina FasoBurundiCabo VerdeCambodiaCameroonCanadaCaribbean small statesCentral African RepublicCentral Europe and the BalticsChadChileChinaColombiaComorosCongo, Dem. Rep.Congo, Rep.Costa RicaCote d'IvoireCroatiaCubaCyprusCzech RepublicDenmarkDominicaDominican RepublicEarly-demographic dividendEast Asia & PacificEast Asia & Pacific (excluding high income)East Asia & Pacific (IDA & IBRD countries)EcuadorEgypt, Arab Rep.El SalvadorEquatorial GuineaEritreaEstoniaEuro areaEurope & Central AsiaEurope & Central Asia (excluding high income)Europe & Central Asia (IDA & IBRD countries)European UnionFinlandFragile and conflict affected situationsFranceGabonGambia, TheGeorgiaGermanyGhanaGreeceGrenadaGuatemalaGuineaGuinea-BissauGuyanaHaitiHeavily indebted poor countries (HIPC)High incomeHondurasHong Kong SAR, ChinaHungaryIBRD onlyIcelandIDA & IBRD totalIDA blendIDA onlyIDA totalIndiaIndonesiaIran, Islamic Rep.IraqIrelandIsraelItalyJamaicaJapanJordanKazakhstanKenyaKorea, Rep.KosovoKyrgyz RepublicLao PDRLate-demographic dividendLatin America & Caribbean Latin America & Caribbean (excluding high income)Latin America & the Caribbean (IDA & IBRD countries)LatviaLeast developed countries: UN classificationLebanonLiberiaLithuaniaLow & middle incomeLow incomeLower middle incomeLuxembourgMacao SAR, ChinaMacedonia, FYRMadagascarMalawiMalaysiaMaliMaltaMauritaniaMauritiusMexicoMiddle East & North AfricaMiddle East & North Africa (excluding high income)Middle East & North Africa (IDA & IBRD countries)Middle incomeMoldovaMongoliaMontenegroMoroccoMozambiqueNamibiaNepalNetherlandsNew ZealandNicaraguaNigerNigeriaNorth AmericaNorwayOECD membersOmanPakistanPanamaParaguayPeruPhilippinesPolandPortugalPost-demographic dividendPre-demographic dividendPuerto RicoRomaniaRussian FederationRwandaSaudi ArabiaSenegalSerbiaSeychellesSierra LeoneSingaporeSlovak RepublicSloveniaSouth AfricaSouth AsiaSouth Asia (IDA & IBRD)South SudanSpainSri LankaSt. Kitts and NevisSt. LuciaSt. Vincent and the GrenadinesSub-Saharan Africa Sub-Saharan Africa (excluding high income)Sub-Saharan Africa (IDA & IBRD countries)SudanSurinameSwazilandSwedenSwitzerlandTajikistanTanzaniaThailandTimor-LesteTogoTongaTrinidad and TobagoTunisiaTurkeyTurkmenistanUgandaUkraineUnited Arab EmiratesUnited KingdomUnited StatesUpper middle incomeUruguayUzbekistanVanuatuVenezuela, RBVietnamWest Bank and GazaWorldYemen, Rep.ZambiaZimbabwe Timeline:
This timeline shows a graph from 1961 to 2016 of Switzerland. No data until 1960. Number of actual observations by date: 56.
Source name:
World Development Indicators
Source organization:
World Bank national accounts data, and OECD National Accounts data files.
Categories, topics:
Economy & Growth
Last updated:
apr 23, 2017
Indicators value changes by year
Minimum:
38.084 bln
jan 1, 1961
Maximum:
150.352 bln
jan 1, 2016
At the date of observation
Value
Absolute change
Change from previous value
jan 1, 1961
38.084 bln
+38.084 bln
0.0%
jan 1, 1962
44.071 bln
+5.987 bln
15.72%
jan 1, 1963
48.574 bln
+4.503 bln
10.22%
jan 1, 1964
52.129 bln
+3.554 bln
7.32%
jan 1, 1965
56.385 bln
+4.257 bln
8.17%
jan 1, 1966
54.154 bln
-2.231 bln
-3.96%
jan 1, 1967
53.705 bln
-448.621 mln
-0.83%
jan 1, 1968
53.782 bln
+76.361 mln
0.14%
jan 1, 1969
55.435 bln
+1.653 bln
3.07%
jan 1, 1970
58.73 bln
+3.295 bln
5.94%
jan 1, 1971
67.643 bln
+8.913 bln
15.18%
jan 1, 1972
74.311 bln
+6.668 bln
9.86%
jan 1, 1973
78.011 bln
+3.7 bln
4.98%
jan 1, 1974
80.274 bln
+2.263 bln
2.9%
jan 1, 1975
76.859 bln
-3.415 bln
-4.25%
jan 1, 1976
66.423 bln
-10.436 bln
-13.58%
jan 1, 1977
59.443 bln
-6.98 bln
-10.51%
jan 1, 1978
60.406 bln
+962.26 mln
1.62%
jan 1, 1979
64.092 bln
+3.686 bln
6.1%
jan 1, 1980
67.358 bln
+3.266 bln
5.1%
jan 1, 1981
74.04 bln
+6.682 bln
9.92%
jan 1, 1982
75.241 bln
+1.202 bln
1.62%
jan 1, 1983
72.195 bln
-3.047 bln
-4.05%
jan 1, 1984
74.859 bln
+2.664 bln
3.69%
jan 1, 1985
78.148 bln
+3.289 bln
4.39%
jan 1, 1986
80.739 bln
+2.591 bln
3.32%
jan 1, 1987
85.883 bln
+5.144 bln
6.37%
jan 1, 1988
89.355 bln
+3.472 bln
4.04%
jan 1, 1989
96.693 bln
+7.338 bln
8.21%
jan 1, 1990
101.46 bln
+4.767 bln
4.93%
jan 1, 1991
105.833 bln
+4.372 bln
4.31%
jan 1, 1992
103.706 bln
-2.127 bln
-2.01%
jan 1, 1993
96.093 bln
-7.612 bln
-7.34%
jan 1, 1994
92.997 bln
-3.096 bln
-3.22%
jan 1, 1995
96.969 bln
+3.972 bln
4.27%
jan 1, 1996
100.754 bln
+3.785 bln
3.9%
jan 1, 1997
99.634 bln
-1.12 bln
-1.11%
jan 1, 1998
102.906 bln
+3.273 bln
3.28%
jan 1, 1999
110.004 bln
+7.098 bln
6.9%
jan 1, 2000
112.41 bln
+2.406 bln
2.19%
jan 1, 2001
117.918 bln
+5.508 bln
4.9%
jan 1, 2002
115.552 bln
-2.366 bln
-2.01%
jan 1, 2003
115.776 bln
+223.955 mln
0.19%
jan 1, 2004
114.575 bln
-1.202 bln
-1.04%
jan 1, 2005
120.399 bln
+5.825 bln
5.08%
jan 1, 2006
124.251 bln
+3.852 bln
3.2%
jan 1, 2007
130.061 bln
+5.811 bln
4.68%
jan 1, 2008
136.499 bln
+6.437 bln
4.95%
jan 1, 2009
137.504 bln
+1.005 bln
0.74%
jan 1, 2010
127.163 bln
-10.341 bln
-7.52%
jan 1, 2011
132.736 bln
+5.572 bln
4.38%
jan 1, 2012
138.384 bln
+5.648 bln
4.26%
jan 1, 2013
142.329 bln
+3.945 bln
2.85%
jan 1, 2014
143.863 bln
+1.534 bln
1.08%
jan 1, 2015
147.947 bln
+4.084 bln
2.84%
jan 1, 2016
150.352 bln
+2.405 bln
1.63%
Ranking of countries by current statistics by years


Comments: