29
/
en
AIzaSyAYiBZKx7MnpbEhh9jyipgxe19OcubqV5w
April 1, 2024
256396
Sweden
SWE
true
2
1
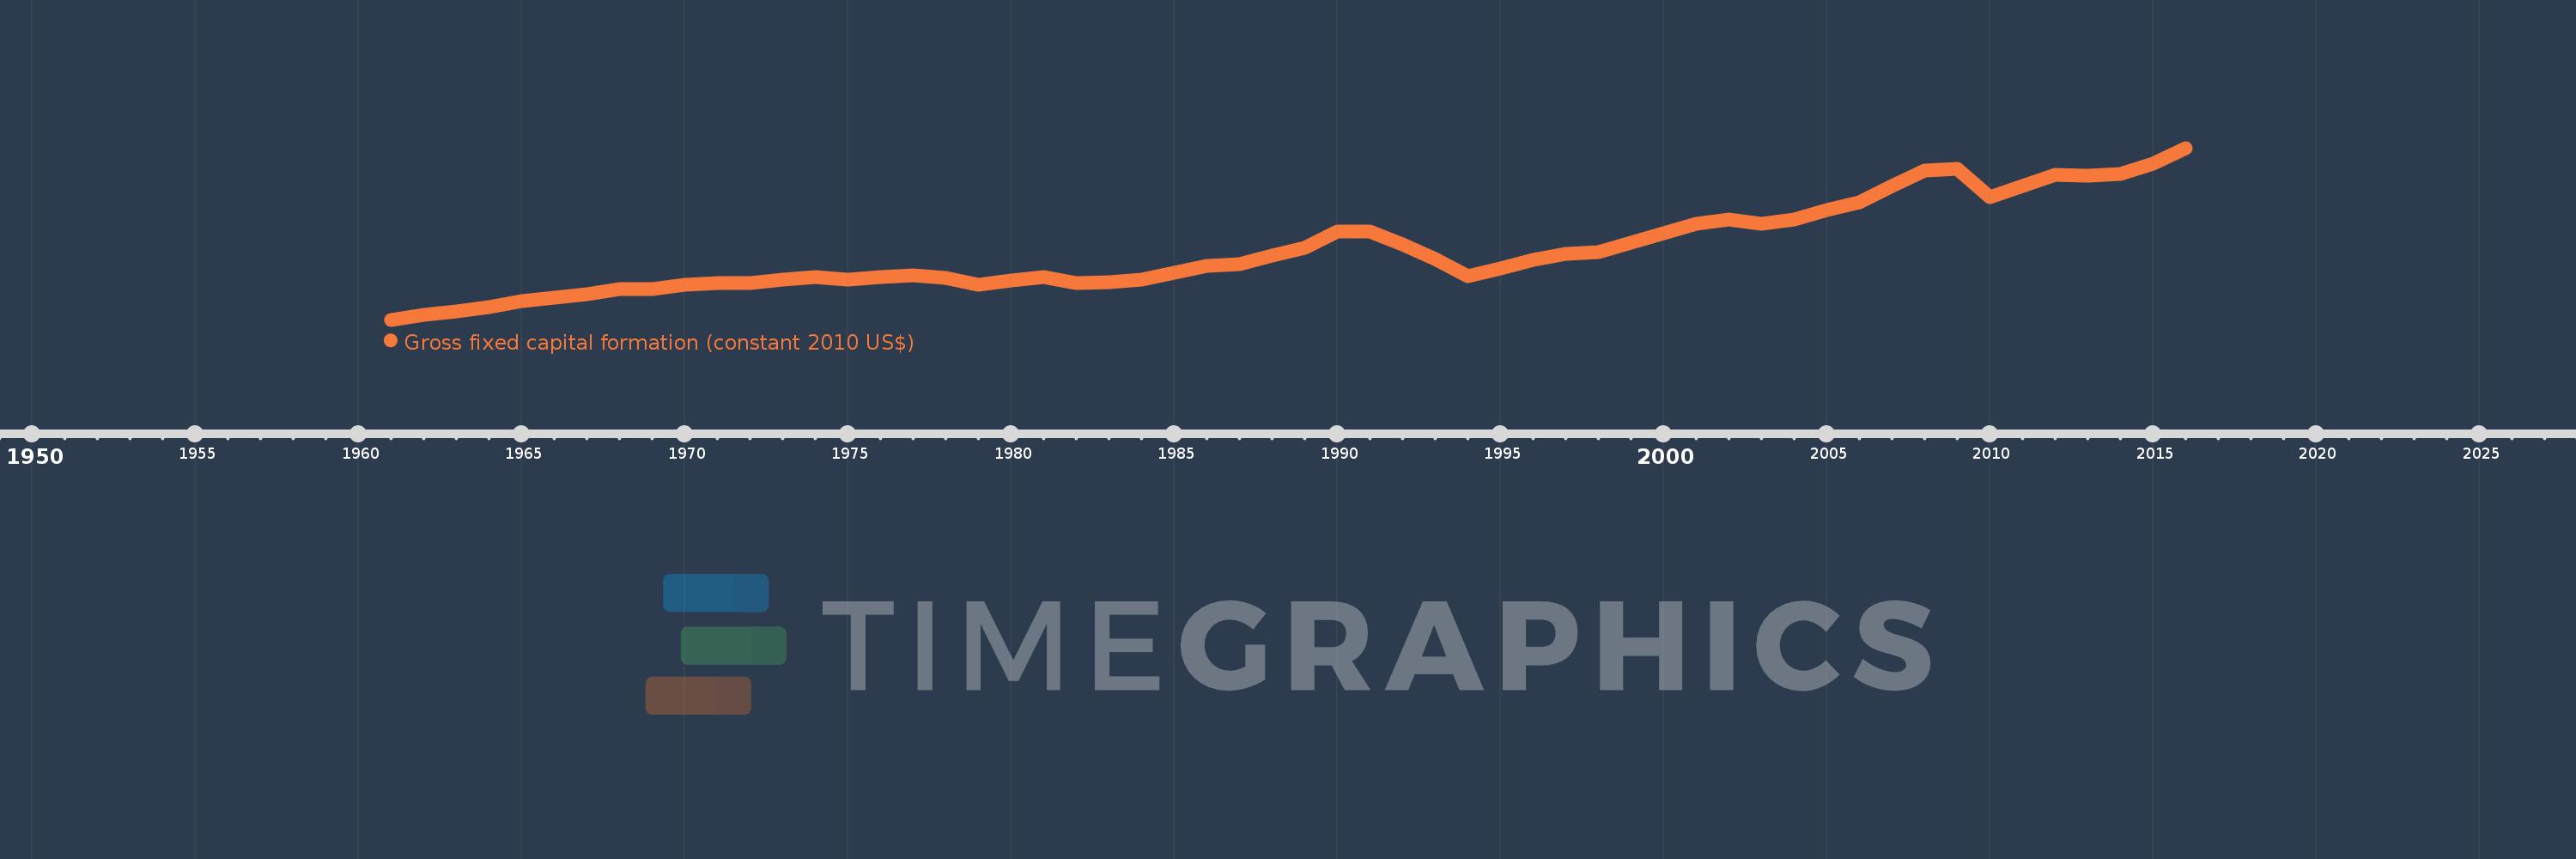
Gross fixed capital formation (constant 2010 US$)
2016,2015,2014,2013,2012,2011,2010,2009,2008,2007,2006,2005,2004,2003,2002,2001,2000,1999,1998,1997,1996,1995,1994,1993,1992,1991,1990,1989,1988,1987,1986,1985,1984,1983,1982,1981,1980,1979,1978,1977,1976,1975,1974,1973,1972,1971,1970,1969,1968,1967,1966,1965,1964,1963,1962,1961
This statistics in other country:
AfghanistanAlbaniaAlgeriaAngolaAntigua and BarbudaArab WorldArgentinaArmeniaAustraliaAustriaAzerbaijanBahamas, TheBahrainBangladeshBarbadosBelarusBelgiumBelizeBeninBermudaBhutanBoliviaBosnia and HerzegovinaBotswanaBrazilBrunei DarussalamBulgariaBurkina FasoBurundiCabo VerdeCambodiaCameroonCanadaCaribbean small statesCentral African RepublicCentral Europe and the BalticsChadChileChinaColombiaComorosCongo, Dem. Rep.Congo, Rep.Costa RicaCote d'IvoireCroatiaCubaCyprusCzech RepublicDenmarkDominicaDominican RepublicEarly-demographic dividendEast Asia & PacificEast Asia & Pacific (excluding high income)East Asia & Pacific (IDA & IBRD countries)EcuadorEgypt, Arab Rep.El SalvadorEquatorial GuineaEritreaEstoniaEuro areaEurope & Central AsiaEurope & Central Asia (excluding high income)Europe & Central Asia (IDA & IBRD countries)European UnionFinlandFragile and conflict affected situationsFranceGabonGambia, TheGeorgiaGermanyGhanaGreeceGrenadaGuatemalaGuineaGuinea-BissauGuyanaHaitiHeavily indebted poor countries (HIPC)High incomeHondurasHong Kong SAR, ChinaHungaryIBRD onlyIcelandIDA & IBRD totalIDA blendIDA onlyIDA totalIndiaIndonesiaIran, Islamic Rep.IraqIrelandIsraelItalyJamaicaJapanJordanKazakhstanKenyaKorea, Rep.KosovoKyrgyz RepublicLao PDRLate-demographic dividendLatin America & Caribbean Latin America & Caribbean (excluding high income)Latin America & the Caribbean (IDA & IBRD countries)LatviaLeast developed countries: UN classificationLebanonLiberiaLithuaniaLow & middle incomeLow incomeLower middle incomeLuxembourgMacao SAR, ChinaMacedonia, FYRMadagascarMalawiMalaysiaMaliMaltaMauritaniaMauritiusMexicoMiddle East & North AfricaMiddle East & North Africa (excluding high income)Middle East & North Africa (IDA & IBRD countries)Middle incomeMoldovaMongoliaMontenegroMoroccoMozambiqueNamibiaNepalNetherlandsNew ZealandNicaraguaNigerNigeriaNorth AmericaNorwayOECD membersOmanPakistanPanamaParaguayPeruPhilippinesPolandPortugalPost-demographic dividendPre-demographic dividendPuerto RicoRomaniaRussian FederationRwandaSaudi ArabiaSenegalSerbiaSeychellesSierra LeoneSingaporeSlovak RepublicSloveniaSouth AfricaSouth AsiaSouth Asia (IDA & IBRD)South SudanSpainSri LankaSt. Kitts and NevisSt. LuciaSt. Vincent and the GrenadinesSub-Saharan Africa Sub-Saharan Africa (excluding high income)Sub-Saharan Africa (IDA & IBRD countries)SudanSurinameSwazilandSwedenSwitzerlandTajikistanTanzaniaThailandTimor-LesteTogoTongaTrinidad and TobagoTunisiaTurkeyTurkmenistanUgandaUkraineUnited Arab EmiratesUnited KingdomUnited StatesUpper middle incomeUruguayUzbekistanVanuatuVenezuela, RBVietnamWest Bank and GazaWorldYemen, Rep.ZambiaZimbabwe Timeline:
This timeline shows a graph from 1961 to 2016 of Sweden. No data until 1960. Number of actual observations by date: 56.
Source name:
World Development Indicators
Source organization:
World Bank national accounts data, and OECD National Accounts data files.
Categories, topics:
Economy & Growth
Last updated:
apr 23, 2017
Indicators value changes by year
Minimum:
32.606 bln
jan 1, 1961
Maximum:
130.297 bln
jan 1, 2016
At the date of observation
Value
Absolute change
Change from previous value
jan 1, 1961
32.606 bln
+32.606 bln
0.0%
jan 1, 1962
35.218 bln
+2.612 bln
8.01%
jan 1, 1963
37.451 bln
+2.233 bln
6.34%
jan 1, 1964
39.982 bln
+2.532 bln
6.76%
jan 1, 1965
43.006 bln
+3.024 bln
7.56%
jan 1, 1966
45.226 bln
+2.22 bln
5.16%
jan 1, 1967
47.289 bln
+2.063 bln
4.56%
jan 1, 1968
49.816 bln
+2.527 bln
5.34%
jan 1, 1969
50.14 bln
+323.914 mln
0.65%
jan 1, 1970
52.295 bln
+2.155 bln
4.3%
jan 1, 1971
53.637 bln
+1.343 bln
2.57%
jan 1, 1972
53.328 bln
-309.452 mln
-0.58%
jan 1, 1973
55.55 bln
+2.222 bln
4.17%
jan 1, 1974
57.027 bln
+1.478 bln
2.66%
jan 1, 1975
55.3 bln
-1.728 bln
-3.03%
jan 1, 1976
57.009 bln
+1.709 bln
3.09%
jan 1, 1977
58.068 bln
+1.059 bln
1.86%
jan 1, 1978
56.358 bln
-1.71 bln
-2.94%
jan 1, 1979
52.502 bln
-3.856 bln
-6.84%
jan 1, 1980
54.847 bln
+2.344 bln
4.47%
jan 1, 1981
56.743 bln
+1.896 bln
3.46%
jan 1, 1982
53.449 bln
-3.294 bln
-5.8%
jan 1, 1983
53.795 bln
+345.985 mln
0.65%
jan 1, 1984
55.199 bln
+1.404 bln
2.61%
jan 1, 1985
59.306 bln
+4.107 bln
7.44%
jan 1, 1986
63.453 bln
+4.147 bln
6.99%
jan 1, 1987
64.16 bln
+707.466 mln
1.11%
jan 1, 1988
69.267 bln
+5.107 bln
7.96%
jan 1, 1989
73.656 bln
+4.389 bln
6.34%
jan 1, 1990
82.571 bln
+8.914 bln
12.1%
jan 1, 1991
82.709 bln
+138.571 mln
0.17%
jan 1, 1992
75.643 bln
-7.066 bln
-8.54%
jan 1, 1993
67.094 bln
-8.549 bln
-11.3%
jan 1, 1994
57.265 bln
-9.829 bln
-14.65%
jan 1, 1995
61.632 bln
+4.367 bln
7.63%
jan 1, 1996
66.557 bln
+4.924 bln
7.99%
jan 1, 1997
70.037 bln
+3.481 bln
5.23%
jan 1, 1998
70.992 bln
+954.561 mln
1.36%
jan 1, 1999
76.556 bln
+5.564 bln
7.84%
jan 1, 2000
81.936 bln
+5.381 bln
7.03%
jan 1, 2001
87.261 bln
+5.324 bln
6.5%
jan 1, 2002
89.416 bln
+2.156 bln
2.47%
jan 1, 2003
87.396 bln
-2.021 bln
-2.26%
jan 1, 2004
89.545 bln
+2.15 bln
2.46%
jan 1, 2005
94.749 bln
+5.204 bln
5.81%
jan 1, 2006
99.549 bln
+4.8 bln
5.07%
jan 1, 2007
108.849 bln
+9.3 bln
9.34%
jan 1, 2008
117.672 bln
+8.823 bln
8.11%
jan 1, 2009
118.33 bln
+658.342 mln
0.56%
jan 1, 2010
102.509 bln
-15.821 bln
-13.37%
jan 1, 2011
108.681 bln
+6.171 bln
6.02%
jan 1, 2012
114.823 bln
+6.142 bln
5.65%
jan 1, 2013
114.559 bln
-263.753 mln
-0.23%
jan 1, 2014
115.283 bln
+724.384 mln
0.63%
jan 1, 2015
121.581 bln
+6.297 bln
5.46%
jan 1, 2016
130.297 bln
+8.717 bln
7.17%
Ranking of countries by current statistics by years


Comments: